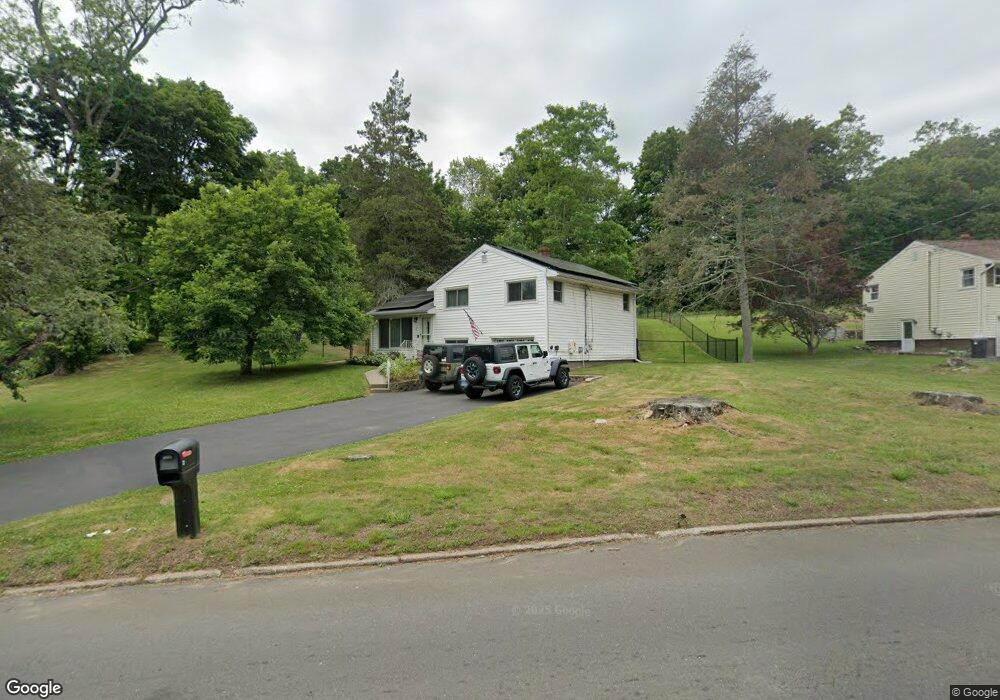
2 Charnes Dr East Haven, CT 06513
Estimated Value: $348,000 - $391,000
3
Beds
1
Bath
1,040
Sq Ft
$353/Sq Ft
Est. Value
About This Home
This home is located at 2 Charnes Dr, East Haven, CT 06513 and is currently estimated at $366,877, approximately $352 per square foot. 2 Charnes Dr is a home located in New Haven County with nearby schools including Deer Run School, East Haven High School, and All Nations Christian Academy.
Ownership History
Date
Name
Owned For
Owner Type
Purchase Details
Closed on
May 25, 2007
Sold by
Berardi John S and Berardi Theresa G
Bought by
Demartino Jillian M and Jack Daniel M
Current Estimated Value
Home Financials for this Owner
Home Financials are based on the most recent Mortgage that was taken out on this home.
Original Mortgage
$180,000
Interest Rate
6.27%
Purchase Details
Closed on
Jun 2, 2003
Sold by
Hurley James P
Bought by
Berardi John S and Berardi Theresa G
Home Financials for this Owner
Home Financials are based on the most recent Mortgage that was taken out on this home.
Original Mortgage
$172,900
Interest Rate
5.86%
Purchase Details
Closed on
May 9, 2001
Sold by
Est Riggione Mary E and Riggione Michael
Bought by
Hurley Michelle and Hurley James P
Create a Home Valuation Report for This Property
The Home Valuation Report is an in-depth analysis detailing your home's value as well as a comparison with similar homes in the area
Home Values in the Area
Average Home Value in this Area
Purchase History
| Date | Buyer | Sale Price | Title Company |
|---|---|---|---|
| Demartino Jillian M | $225,000 | -- | |
| Berardi John S | $182,000 | -- | |
| Hurley Michelle | $125,000 | -- |
Source: Public Records
Mortgage History
| Date | Status | Borrower | Loan Amount |
|---|---|---|---|
| Open | Hurley Michelle | $233,100 | |
| Closed | Hurley Michelle | $180,000 | |
| Closed | Hurley Michelle | $45,000 | |
| Previous Owner | Hurley Michelle | $172,900 |
Source: Public Records
Tax History
| Year | Tax Paid | Tax Assessment Tax Assessment Total Assessment is a certain percentage of the fair market value that is determined by local assessors to be the total taxable value of land and additions on the property. | Land | Improvement |
|---|---|---|---|---|
| 2025 | $5,061 | $151,340 | $52,710 | $98,630 |
| 2024 | $5,061 | $151,340 | $52,710 | $98,630 |
| 2023 | $4,722 | $151,340 | $52,710 | $98,630 |
| 2022 | $4,722 | $151,340 | $52,710 | $98,630 |
| 2021 | $4,347 | $126,920 | $58,590 | $68,330 |
| 2020 | $4,347 | $126,920 | $58,590 | $68,330 |
| 2019 | $4,115 | $126,920 | $58,590 | $68,330 |
| 2018 | $4,119 | $126,920 | $58,590 | $68,330 |
| 2017 | $4,004 | $126,920 | $58,590 | $68,330 |
| 2016 | $3,890 | $123,300 | $52,080 | $71,220 |
| 2015 | $3,890 | $123,300 | $52,080 | $71,220 |
| 2014 | $3,952 | $123,300 | $52,080 | $71,220 |
Source: Public Records
Map
Nearby Homes
- 203 Thompson St Unit E
- 1 Birch Ln Unit A
- 4 Dora Dr
- 75 Redwood Dr Unit 103
- 75 Redwood Dr Unit 907
- 300 Foxon Hill Rd
- 69 Oak Ridge Dr Unit 51
- 55 Thompson St Unit 11G
- 21 Highland Ave
- 80 Roosevelt St
- 123 Pleasant Ave
- 52 Glen Haven Rd
- 214 Maple St
- 13 Robin Dr
- 1706 Quinnipiac Ave
- 1445 Quinnipiac Ave
- 116 Old Foxon Rd
- 173 Russo Ave Unit 304
- 173 Russo Ave Unit 408
- 445 Strong St
- 4 Charnes Dr
- 106 Foxon Hill Rd
- 81 Foxon Hill Rd
- 6 Charnes Dr
- 3 Englewood Dr
- 3 Charnes Dr
- 23 Kristen Ct
- 17 Kristen Ct
- 82 Foxon Hill Rd
- 5 Charnes Dr
- 8 Charnes Dr
- 29 Kristen Ct
- 6 Englewood Dr
- 5 Englewood Dr
- 11 Kristen Ct
- 35 Kristen Ct
- 7 Charnes Dr
- 70 Foxon Hill Rd
- 70 Foxon Hill Rd Unit RD
- 10 Charnes Dr
Your Personal Tour Guide
Ask me questions while you tour the home.