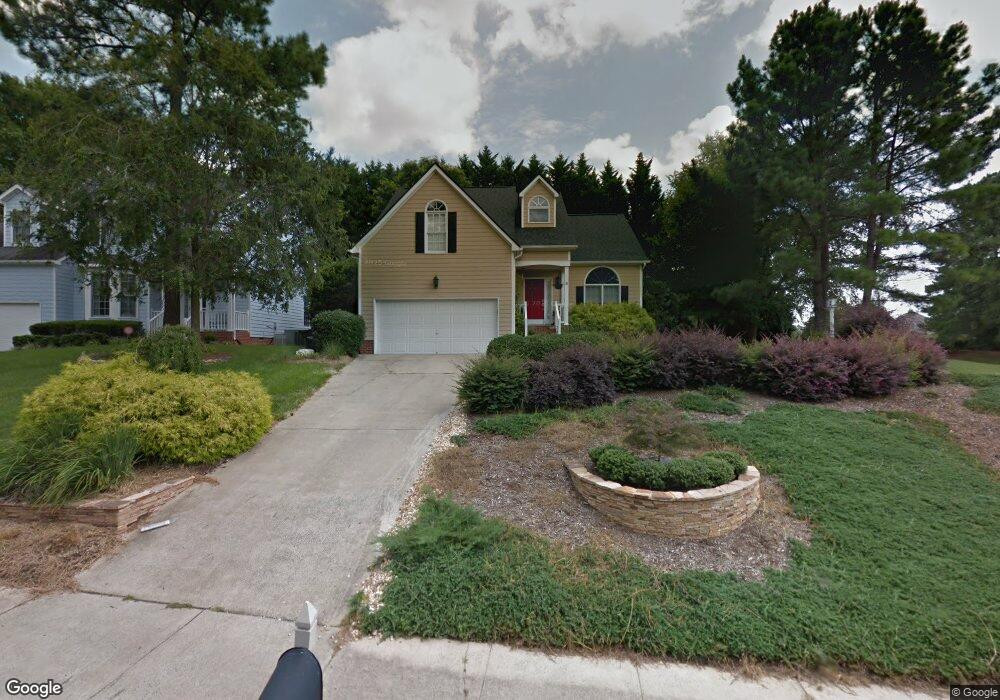
2 Chestnut Bluffs Ln Durham, NC 27713
Woodcroft NeighborhoodEstimated Value: $449,682 - $516,000
3
Beds
3
Baths
1,850
Sq Ft
$264/Sq Ft
Est. Value
About This Home
This home is located at 2 Chestnut Bluffs Ln, Durham, NC 27713 and is currently estimated at $488,171, approximately $263 per square foot. 2 Chestnut Bluffs Ln is a home located in Durham County with nearby schools including Southwest Elementary School, Morehead Montessori, and Sherwood Githens Middle.
Ownership History
Date
Name
Owned For
Owner Type
Purchase Details
Closed on
Jun 21, 2007
Sold by
Mcdermott Deborah Ann and Garcia Phillip Scott
Bought by
Mcdermott Deborah Ann and Garcia Phillip Scott
Current Estimated Value
Purchase Details
Closed on
Oct 16, 2005
Sold by
Schweikert Elayne and Huber William
Bought by
Mcdermott Deborah Ann and Garcia Phillip Scott
Home Financials for this Owner
Home Financials are based on the most recent Mortgage that was taken out on this home.
Original Mortgage
$183,200
Outstanding Balance
$97,438
Interest Rate
5.66%
Mortgage Type
Fannie Mae Freddie Mac
Estimated Equity
$390,733
Purchase Details
Closed on
Apr 28, 2001
Sold by
Stewart Gina M and Batalia Michael A
Bought by
Schweikert Elayne
Home Financials for this Owner
Home Financials are based on the most recent Mortgage that was taken out on this home.
Original Mortgage
$181,450
Interest Rate
6.9%
Create a Home Valuation Report for This Property
The Home Valuation Report is an in-depth analysis detailing your home's value as well as a comparison with similar homes in the area
Home Values in the Area
Average Home Value in this Area
Purchase History
| Date | Buyer | Sale Price | Title Company |
|---|---|---|---|
| Mcdermott Deborah Ann | -- | None Available | |
| Mcdermott Deborah Ann | $229,000 | -- | |
| Schweikert Elayne | $191,000 | -- |
Source: Public Records
Mortgage History
| Date | Status | Borrower | Loan Amount |
|---|---|---|---|
| Open | Mcdermott Deborah Ann | $183,200 | |
| Previous Owner | Schweikert Elayne | $181,450 |
Source: Public Records
Tax History
| Year | Tax Paid | Tax Assessment Tax Assessment Total Assessment is a certain percentage of the fair market value that is determined by local assessors to be the total taxable value of land and additions on the property. | Land | Improvement |
|---|---|---|---|---|
| 2025 | $4,417 | $445,604 | $118,000 | $327,604 |
| 2024 | $3,637 | $260,718 | $53,190 | $207,528 |
| 2023 | $3,415 | $260,718 | $53,190 | $207,528 |
| 2022 | $3,337 | $260,718 | $53,190 | $207,528 |
| 2021 | $3,321 | $260,718 | $53,190 | $207,528 |
| 2020 | $3,243 | $260,718 | $53,190 | $207,528 |
| 2019 | $3,243 | $260,718 | $53,190 | $207,528 |
| 2018 | $3,404 | $250,950 | $44,325 | $206,625 |
| 2017 | $3,379 | $250,950 | $44,325 | $206,625 |
| 2016 | $3,265 | $250,950 | $44,325 | $206,625 |
| 2015 | $3,468 | $250,540 | $45,375 | $205,165 |
| 2014 | $3,468 | $250,540 | $45,375 | $205,165 |
Source: Public Records
Map
Nearby Homes
- 2 Hurdle Ct
- 4 Applewood Square
- 10 Hickorywood Square
- 3805 Chimney Ridge Place Unit 104
- 527 Woodwinds Dr
- 708 Sleepy Creek Dr
- 3700 Chimney Ridge Place Unit 201
- 5500 Fortunes Ridge Dr Unit 80b
- 5500 Fortunes Ridge Dr Unit 89B
- 5219 Oakbrook Dr
- 135 Long Shadow Place
- 200 W Woodcroft Pkwy Unit 53b
- 233 Morningside Dr
- 4907 Fortunes Ridge Dr
- 5109 Carolwood Ln
- 212 Old Fox Trail
- 4 Barkridge Ct
- 27 Falling Water Dr
- 4727 Alderbrook Ln
- 4731 Alderbrook Ln
- 4 Chestnut Bluffs Ln
- 6 Chestnut Bluffs Ln
- 1 Citation Dr
- 1 Chestnut Bluffs Ln
- 5 Chestnut Bluffs Ln
- 3 Citation Dr
- 8 Chestnut Bluffs Ln
- 7 Chestnut Bluffs Ln
- 6 Hearthwood Cir
- 8 Hearthwood Cir
- 5 Citation Dr
- 4 Hearthwood Cir
- 7 Citation Dr
- 9 Citation Dr
- 10 Hearthwood Cir
- 627 Woodwinds Dr
- 12 Hearthwood Cir
- 10 Chestnut Bluffs Ln
- 9 Chestnut Bluffs Ln
- 2 Preakness Dr
Your Personal Tour Guide
Ask me questions while you tour the home.