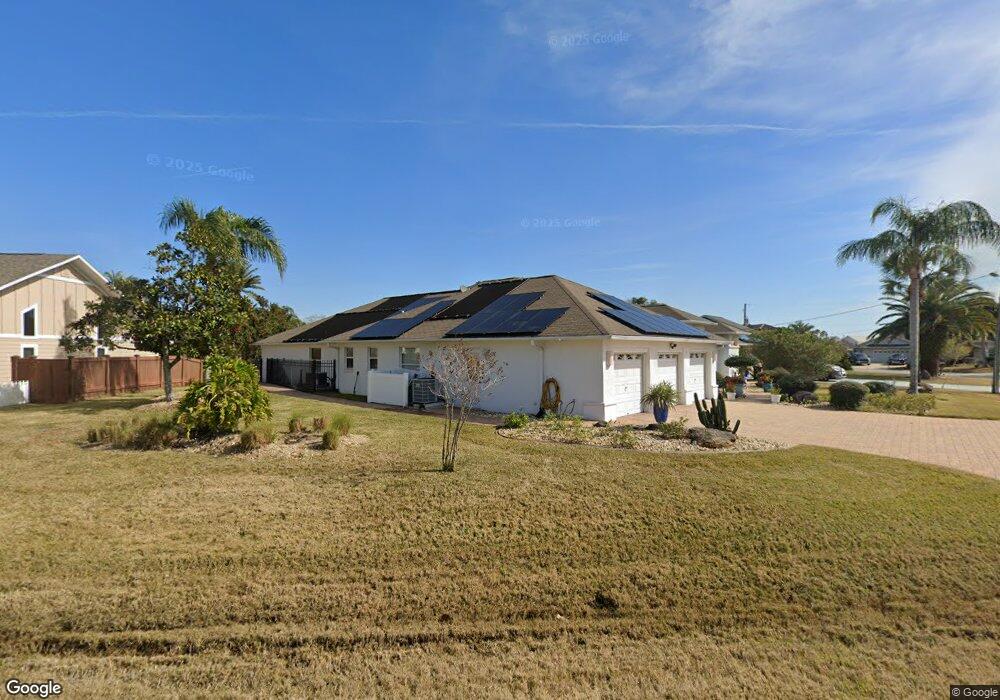
2 Chinook Ct Palm Coast, FL 32137
Estimated Value: $752,943 - $966,000
--
Bed
3
Baths
3,311
Sq Ft
$258/Sq Ft
Est. Value
About This Home
This home is located at 2 Chinook Ct, Palm Coast, FL 32137 and is currently estimated at $854,736, approximately $258 per square foot. 2 Chinook Ct is a home located in Flagler County with nearby schools including Old Kings Elementary School, Indian Trails Middle School, and Matanzas High School.
Ownership History
Date
Name
Owned For
Owner Type
Purchase Details
Closed on
Nov 30, 2006
Sold by
Wheeler James and Wheeler Jeanette B
Bought by
Wheeler James and Wheeler Jeanette B
Current Estimated Value
Purchase Details
Closed on
Jun 14, 2005
Sold by
Hanzel Joseph A and Bedell Judy M
Bought by
Wheeler James and Wheeler Jeanette B
Purchase Details
Closed on
Mar 2, 1999
Sold by
Martel Jeff G and Martel Kathy A
Bought by
Hanzel Joseph A
Purchase Details
Closed on
Jul 24, 1998
Sold by
Vanderbur John R and Vanderbur Deborah A
Bought by
Martel Jeff G and Martel Kathy A
Home Financials for this Owner
Home Financials are based on the most recent Mortgage that was taken out on this home.
Original Mortgage
$275,200
Interest Rate
7.02%
Purchase Details
Closed on
Apr 22, 1996
Sold by
Gandhi Ramesh H and Gandhi Kumud R
Bought by
Vanderbur John R and Vanderbur Deborah A
Create a Home Valuation Report for This Property
The Home Valuation Report is an in-depth analysis detailing your home's value as well as a comparison with similar homes in the area
Home Values in the Area
Average Home Value in this Area
Purchase History
| Date | Buyer | Sale Price | Title Company |
|---|---|---|---|
| Wheeler James | -- | Attorney | |
| Wheeler James | $800,000 | -- | |
| Hanzel Joseph A | $357,000 | -- | |
| Martel Jeff G | $344,000 | -- | |
| Vanderbur John R | $99,000 | -- |
Source: Public Records
Mortgage History
| Date | Status | Borrower | Loan Amount |
|---|---|---|---|
| Previous Owner | Martel Jeff G | $275,200 |
Source: Public Records
Tax History Compared to Growth
Tax History
| Year | Tax Paid | Tax Assessment Tax Assessment Total Assessment is a certain percentage of the fair market value that is determined by local assessors to be the total taxable value of land and additions on the property. | Land | Improvement |
|---|---|---|---|---|
| 2024 | $4,932 | $318,174 | -- | -- |
| 2023 | $4,932 | $308,907 | $0 | $0 |
| 2022 | $4,894 | $299,910 | $0 | $0 |
| 2021 | $4,842 | $291,175 | $0 | $0 |
| 2020 | $4,842 | $287,154 | $0 | $0 |
| 2019 | $4,770 | $280,698 | $0 | $0 |
| 2018 | $4,754 | $275,464 | $0 | $0 |
| 2017 | $4,647 | $269,798 | $0 | $0 |
| 2016 | $4,542 | $264,249 | $0 | $0 |
| 2015 | $4,540 | $262,218 | $0 | $0 |
| 2014 | $4,562 | $260,137 | $0 | $0 |
Source: Public Records
Map
Nearby Homes