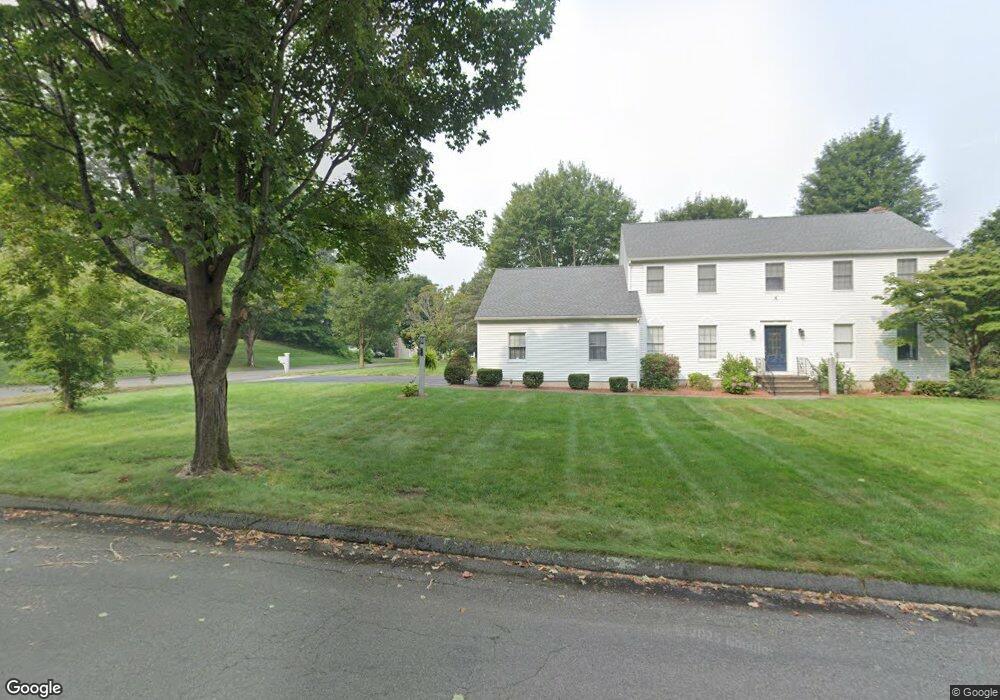
2 Christopher Cir Wilbraham, MA 01095
Estimated Value: $614,328 - $772,000
4
Beds
3
Baths
2,796
Sq Ft
$244/Sq Ft
Est. Value
About This Home
This home is located at 2 Christopher Cir, Wilbraham, MA 01095 and is currently estimated at $682,082, approximately $243 per square foot. 2 Christopher Cir is a home located in Hampden County with nearby schools including Minnechaug Regional High School, Springfield International Charter School, and Wilbraham & Monson Academy.
Ownership History
Date
Name
Owned For
Owner Type
Purchase Details
Closed on
Oct 2, 2020
Sold by
Mcdiarmid Robert F
Bought by
Hogan Jillian and Mcdiarmid Susan
Current Estimated Value
Purchase Details
Closed on
May 23, 1986
Bought by
Mcdiarmid Robert F and Mcdiarmid Patricia L
Create a Home Valuation Report for This Property
The Home Valuation Report is an in-depth analysis detailing your home's value as well as a comparison with similar homes in the area
Home Values in the Area
Average Home Value in this Area
Purchase History
| Date | Buyer | Sale Price | Title Company |
|---|---|---|---|
| Hogan Jillian | -- | None Available | |
| Mcdiarmid Robert F | $185,000 | -- |
Source: Public Records
Mortgage History
| Date | Status | Borrower | Loan Amount |
|---|---|---|---|
| Previous Owner | Mcdiarmid Robert F | $50,000 | |
| Previous Owner | Mcdiarmid Robert F | $165,000 | |
| Previous Owner | Mcdiarmid Robert F | $135,000 | |
| Previous Owner | Mcdiarmid Robert F | $30,000 |
Source: Public Records
Tax History
| Year | Tax Paid | Tax Assessment Tax Assessment Total Assessment is a certain percentage of the fair market value that is determined by local assessors to be the total taxable value of land and additions on the property. | Land | Improvement |
|---|---|---|---|---|
| 2025 | $10,601 | $592,900 | $117,000 | $475,900 |
| 2024 | $10,391 | $561,700 | $117,000 | $444,700 |
| 2023 | $9,243 | $502,700 | $117,000 | $385,700 |
| 2022 | $9,243 | $451,100 | $117,000 | $334,100 |
| 2021 | $9,267 | $403,600 | $122,200 | $281,400 |
| 2020 | $9,033 | $403,600 | $122,200 | $281,400 |
| 2019 | $8,798 | $403,600 | $122,200 | $281,400 |
| 2018 | $8,771 | $387,400 | $122,200 | $265,200 |
| 2017 | $8,523 | $387,400 | $122,200 | $265,200 |
| 2016 | $8,223 | $380,700 | $136,000 | $244,700 |
| 2015 | $7,949 | $380,700 | $136,000 | $244,700 |
Source: Public Records
Map
Nearby Homes
- 6 Katie St
- 59 Baldwin Dr
- 85 Baldwin Dr
- 107 Baldwin Dr
- 24 Mcintosh Dr
- 230V Burleigh Rd
- 46 Holland Dr
- 16 Deerfoot Dr
- 208 Tamarack Dr
- 25 Angelica Dr
- 25 Winding Brook Ln
- 72 Tanglewood Dr
- 5 Northwood Dr
- 301 Tinkham Rd
- 55 Allen St
- 17 Skyridge Ln
- 6 Brooklawn Rd
- 0 Apple Blossom Ln
- 228 Acrebrook Rd
- 17 Jeanne Marie St
Your Personal Tour Guide
Ask me questions while you tour the home.