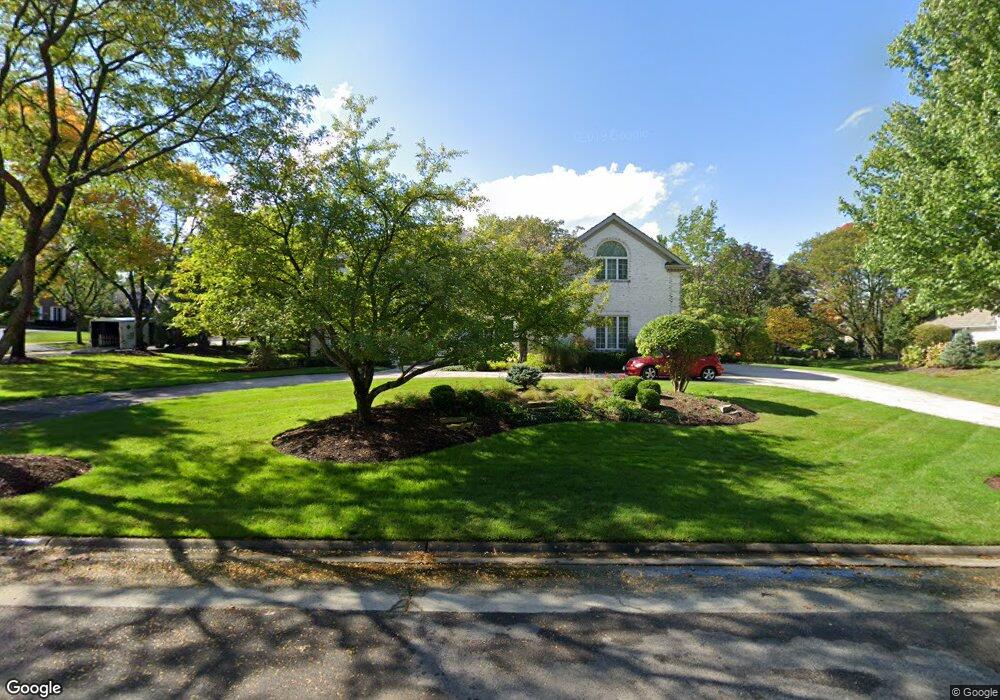
2 Circle Ridge Ct Burr Ridge, IL 60527
Burr Ridge West NeighborhoodEstimated Value: $1,046,000 - $1,168,000
--
Bed
--
Bath
4,704
Sq Ft
$238/Sq Ft
Est. Value
About This Home
This home is located at 2 Circle Ridge Ct, Burr Ridge, IL 60527 and is currently estimated at $1,118,682, approximately $237 per square foot. 2 Circle Ridge Ct is a home located in DuPage County with nearby schools including Anne M. Jeans Elementary School, Burr Ridge Middle School, and Hinsdale South High School.
Ownership History
Date
Name
Owned For
Owner Type
Purchase Details
Closed on
Mar 4, 2021
Sold by
Lorenz Family Trust
Bought by
Lorenz Mark A and Lorenz Carol A
Current Estimated Value
Purchase Details
Closed on
Jul 14, 2018
Sold by
Lorenz Family Trust
Bought by
Lorenz Family Trust
Purchase Details
Closed on
Jun 1, 2010
Sold by
Lorenz Carol A and The Carol A Lorenz Declaration
Bought by
Murray William N and Southpac Trust International I
Purchase Details
Closed on
Jun 9, 2003
Sold by
Lorenz Mark A and Lorenz Carol A
Bought by
Lorenz Carol A and The Carol A Lorenz Declaration
Purchase Details
Closed on
Dec 16, 2002
Sold by
Lorenz Carol A and The Carol A Lorenz Declaration
Bought by
Lorenz Mark A and Lorenz Carol A
Home Financials for this Owner
Home Financials are based on the most recent Mortgage that was taken out on this home.
Original Mortgage
$220,000
Interest Rate
5.86%
Mortgage Type
Purchase Money Mortgage
Purchase Details
Closed on
Nov 30, 1995
Sold by
Lorenz Mark A and Lorenz Carol A
Bought by
Lorenz Carol A
Create a Home Valuation Report for This Property
The Home Valuation Report is an in-depth analysis detailing your home's value as well as a comparison with similar homes in the area
Home Values in the Area
Average Home Value in this Area
Purchase History
| Date | Buyer | Sale Price | Title Company |
|---|---|---|---|
| Lorenz Mark A | -- | None Listed On Document | |
| Lorenz Family Trust | -- | Attorney | |
| Murray William N | -- | None Available | |
| Lorenz Carol A | -- | -- | |
| Lorenz Mark A | -- | Rei Title | |
| Lorenz Carol A | -- | -- |
Source: Public Records
Mortgage History
| Date | Status | Borrower | Loan Amount |
|---|---|---|---|
| Previous Owner | Lorenz Mark A | $220,000 |
Source: Public Records
Tax History Compared to Growth
Tax History
| Year | Tax Paid | Tax Assessment Tax Assessment Total Assessment is a certain percentage of the fair market value that is determined by local assessors to be the total taxable value of land and additions on the property. | Land | Improvement |
|---|---|---|---|---|
| 2024 | $19,177 | $320,064 | $120,137 | $199,927 |
| 2023 | $18,519 | $294,230 | $110,440 | $183,790 |
| 2022 | $18,693 | $304,000 | $113,740 | $190,260 |
| 2021 | $17,934 | $300,550 | $112,450 | $188,100 |
| 2020 | $17,666 | $294,600 | $110,220 | $184,380 |
| 2019 | $17,473 | $296,580 | $119,670 | $176,910 |
| 2018 | $15,646 | $276,510 | $119,070 | $157,440 |
| 2017 | $15,540 | $266,080 | $114,580 | $151,500 |
| 2016 | $15,179 | $253,940 | $109,350 | $144,590 |
| 2015 | $15,160 | $238,910 | $102,880 | $136,030 |
| 2014 | $14,968 | $232,290 | $100,030 | $132,260 |
| 2013 | $14,485 | $231,200 | $99,560 | $131,640 |
Source: Public Records
Map
Nearby Homes
- 4 Keri Ln
- 15W740 90th St
- 10S641 Garfield Ave
- 15W601 S Grant St
- 15W601 89th Place
- 9233 Falling Waters Dr W
- 16W122 91st St
- 9427 Falling Waters Dr W
- 16W234 91st St
- 16W318 95th Place
- 16W130 89th St
- 817 Lakeview Ln
- 8886 Johnston Rd
- 8625 Meadowbrook Dr
- 11901 Heritage Dr
- 16W415 99th St
- 1 Hidden Lake Dr
- 436 Circle Ave
- 24A Kingery Quarter Unit 202
- 12B Kingery Quarter Unit 108
- 125 Circle Ridge Dr
- 4 Circle Ridge Ct
- 1 Circle Ridge Ct
- 119 Circle Ridge Dr
- 130 Circle Ridge Dr
- 132 Circle Ridge Dr
- 5 Circle Ridge Ct
- 3 Circle Ridge Ct
- 134 Circle Ridge Dr
- 128 Circle Ridge Dr
- 117 Circle Ridge Dr
- 6 Devon Ridge Ct
- 137 Circle Ridge Dr
- 136 Circle Ridge Dr
- 120 Circle Ridge Dr
- 126 Circle Ridge Dr
- 115 Circle Ridge Dr
- 122 Circle Ridge Dr
- 5 Devon Ridge Ct
- 149 Circle Ridge Dr