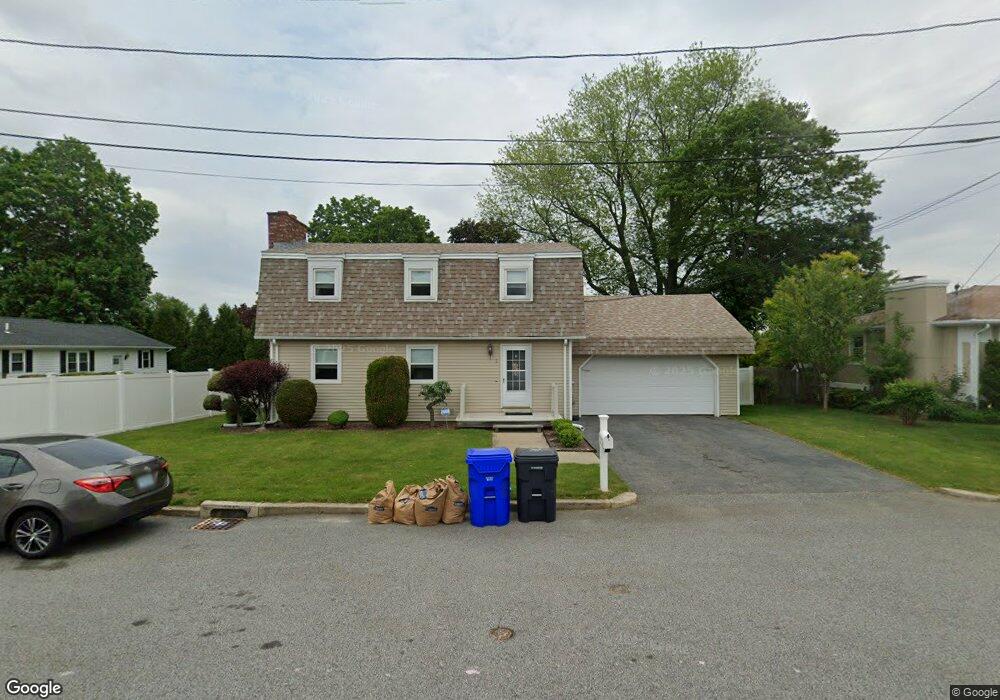
2 City View Cir North Providence, RI 02911
Fruit Hill NeighborhoodEstimated Value: $457,966 - $567,000
3
Beds
2
Baths
2,330
Sq Ft
$221/Sq Ft
Est. Value
About This Home
This home is located at 2 City View Cir, North Providence, RI 02911 and is currently estimated at $514,492, approximately $220 per square foot. 2 City View Cir is a home located in Providence County with nearby schools including North Providence High School, St. Augustine School, and St. Thomas Regional School.
Ownership History
Date
Name
Owned For
Owner Type
Purchase Details
Closed on
Aug 18, 2006
Sold by
Deluca Luca and Deluca Lori J
Bought by
Dudos Jason R and Dudos Jodi A
Current Estimated Value
Purchase Details
Closed on
Sep 1, 1999
Sold by
Balcom Joseph S and Balcom Karen K
Bought by
Deluca Luca and Deluca Lori
Purchase Details
Closed on
Apr 15, 1999
Sold by
Dexter Credit Union
Bought by
Balcom Joseph S and Balcom Karen
Create a Home Valuation Report for This Property
The Home Valuation Report is an in-depth analysis detailing your home's value as well as a comparison with similar homes in the area
Home Values in the Area
Average Home Value in this Area
Purchase History
| Date | Buyer | Sale Price | Title Company |
|---|---|---|---|
| Dudos Jason R | $330,000 | -- | |
| Deluca Luca | $125,000 | -- | |
| Balcom Joseph S | $60,000 | -- | |
| Dudos Jason R | $330,000 | -- | |
| Deluca Luca | $125,000 | -- | |
| Balcom Joseph S | $60,000 | -- |
Source: Public Records
Mortgage History
| Date | Status | Borrower | Loan Amount |
|---|---|---|---|
| Open | Balcom Joseph S | $211,500 | |
| Closed | Balcom Joseph S | $228,000 |
Source: Public Records
Tax History Compared to Growth
Tax History
| Year | Tax Paid | Tax Assessment Tax Assessment Total Assessment is a certain percentage of the fair market value that is determined by local assessors to be the total taxable value of land and additions on the property. | Land | Improvement |
|---|---|---|---|---|
| 2025 | $5,729 | $325,900 | $86,200 | $239,700 |
| 2024 | $5,413 | $325,900 | $86,200 | $239,700 |
| 2023 | $5,413 | $325,900 | $86,200 | $239,700 |
| 2022 | $5,547 | $243,200 | $73,100 | $170,100 |
| 2021 | $5,547 | $243,200 | $73,100 | $170,100 |
| 2020 | $5,547 | $243,200 | $73,100 | $170,100 |
| 2017 | $5,372 | $205,500 | $66,200 | $139,300 |
| 2016 | $5,448 | $195,000 | $58,000 | $137,000 |
| 2015 | $5,448 | $195,000 | $58,000 | $137,000 |
| 2014 | $4,359 | $195,000 | $58,000 | $137,000 |
Source: Public Records
Map
Nearby Homes
- 73 High Service Ave
- 115 Longwood Ave
- 50 Longwood Ave
- 1285 Smith St
- 2 Longwood Ave
- 300 Smithfield Rd Unit P2-2
- 300 Smithfield Rd Unit P3-21
- 300 Smithfield Rd Unit B5-52
- 81 Gentian Ave
- 15 Lookout Ave
- 9 Farnum Ave
- 145 Smithfield Rd Unit B
- 252 Gentian Ave
- 190 Enfield Ave
- 69 Cushing St
- 134 Olney Ave
- 1196 Smith St
- 68 Enfield Ave
- 79 Barrett Ave
- 80 Lubec St