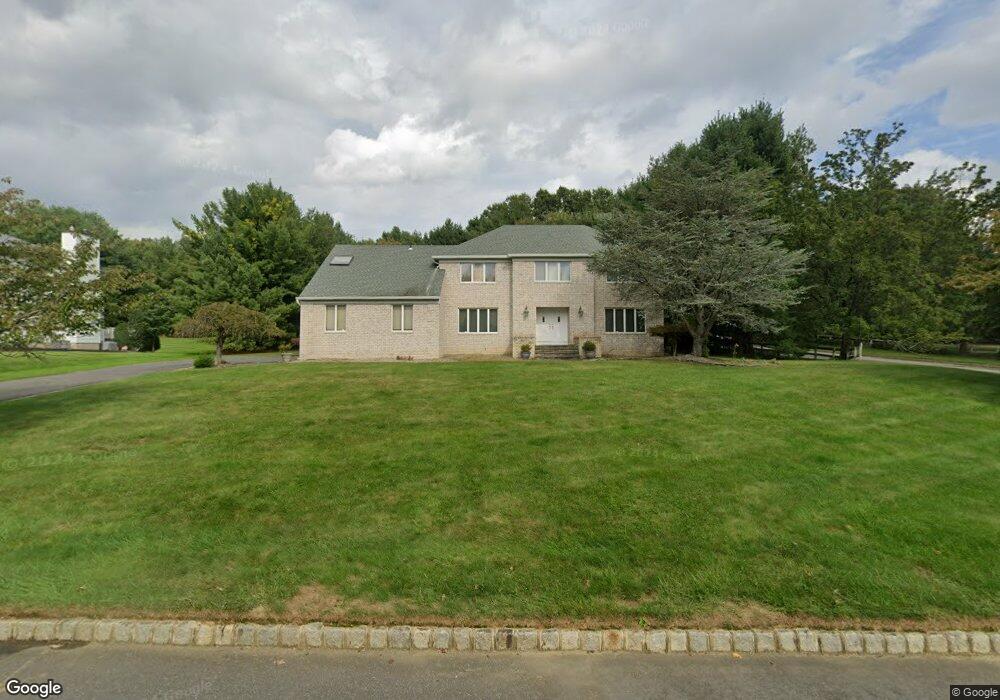
2 Clarendon Ct Holmdel, NJ 07733
Estimated Value: $1,112,000 - $1,425,000
4
Beds
3
Baths
2,973
Sq Ft
$426/Sq Ft
Est. Value
About This Home
This home is located at 2 Clarendon Ct, Holmdel, NJ 07733 and is currently estimated at $1,266,330, approximately $425 per square foot. 2 Clarendon Ct is a home located in Monmouth County with nearby schools including Village School, Indian Hill Elementary School, and William Satz Intermediate School.
Ownership History
Date
Name
Owned For
Owner Type
Purchase Details
Closed on
Feb 17, 2022
Sold by
Wang Wei Tsung and Wang Victor Wei-Tsung
Bought by
Wang Victor Wei-Tsung and Wang Su Kyong
Current Estimated Value
Home Financials for this Owner
Home Financials are based on the most recent Mortgage that was taken out on this home.
Original Mortgage
$238,700
Outstanding Balance
$161,073
Interest Rate
2.93%
Mortgage Type
New Conventional
Estimated Equity
$1,105,257
Purchase Details
Closed on
Nov 4, 1993
Sold by
Lin Cheng Gong
Bought by
Tsung Wei and Wang Su Kyong
Create a Home Valuation Report for This Property
The Home Valuation Report is an in-depth analysis detailing your home's value as well as a comparison with similar homes in the area
Home Values in the Area
Average Home Value in this Area
Purchase History
| Date | Buyer | Sale Price | Title Company |
|---|---|---|---|
| Wang Victor Wei-Tsung | -- | None Listed On Document | |
| Tsung Wei | $425,000 | -- |
Source: Public Records
Mortgage History
| Date | Status | Borrower | Loan Amount |
|---|---|---|---|
| Open | Wang Victor Wei-Tsung | $238,700 |
Source: Public Records
Tax History Compared to Growth
Tax History
| Year | Tax Paid | Tax Assessment Tax Assessment Total Assessment is a certain percentage of the fair market value that is determined by local assessors to be the total taxable value of land and additions on the property. | Land | Improvement |
|---|---|---|---|---|
| 2025 | $16,387 | $1,122,700 | $551,200 | $571,500 |
| 2024 | $15,665 | $1,039,800 | $520,300 | $519,500 |
| 2023 | $15,665 | $962,800 | $474,600 | $488,200 |
| 2022 | $14,527 | $831,800 | $423,900 | $407,900 |
| 2021 | $14,527 | $724,200 | $396,300 | $327,900 |
| 2020 | $14,622 | $717,100 | $402,000 | $315,100 |
| 2019 | $14,375 | $708,500 | $371,500 | $337,000 |
| 2018 | $14,565 | $720,700 | $361,800 | $358,900 |
| 2017 | $15,633 | $770,500 | $353,100 | $417,400 |
| 2016 | $15,571 | $776,200 | $333,700 | $442,500 |
| 2015 | $14,997 | $750,200 | $319,100 | $431,100 |
| 2014 | $14,565 | $696,900 | $362,800 | $334,100 |
Source: Public Records
Map
Nearby Homes
- 118 State Route 34
- 123 State Route 34
- 8 Tiberon Dr
- 8 Aspen Ct
- 11 Goldsmith Dr
- 34 Line Rd
- 15 Goldsmith Dr
- 14 Schanck Rd
- 3 Forest Park Ct
- 832 Holmdel Rd
- 47 White Oak Ln
- 9 Jubilee Cir
- 830 & 832 Holmdel Rd
- 830 Holmdel Rd
- 610 Randall Way
- 3 Tolas Dr
- 702 Wellington Place Unit 2
- 702 Wellington Place Unit 702
- 9 W Aspen Way
- 214 Walnut Dr