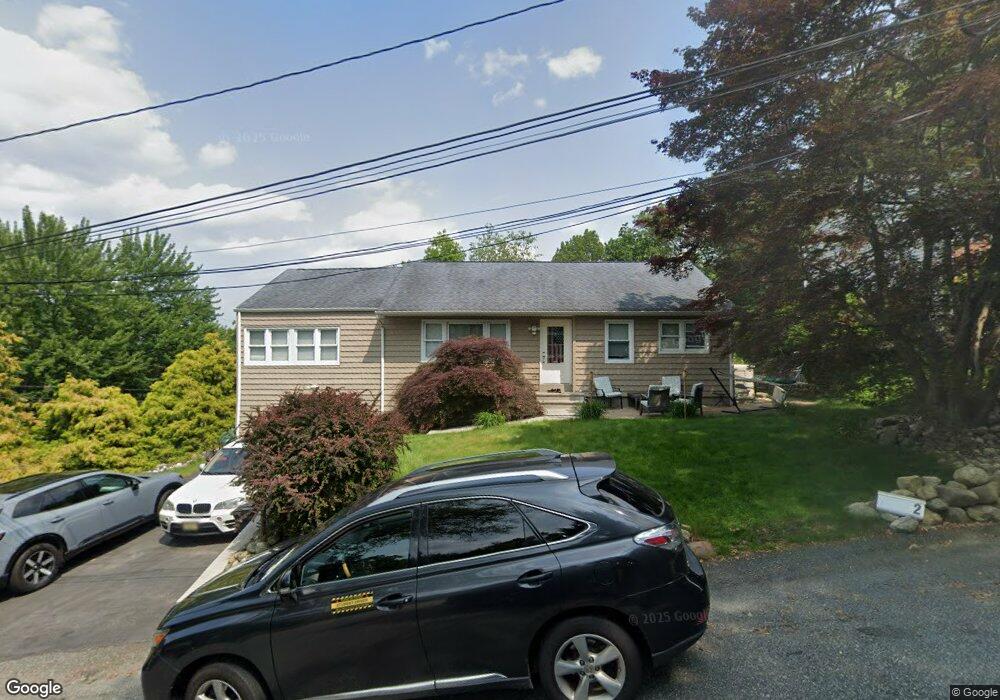
2 Cleary Ave Butler, NJ 07405
Estimated Value: $521,163 - $555,000
--
Bed
--
Bath
1,368
Sq Ft
$397/Sq Ft
Est. Value
About This Home
This home is located at 2 Cleary Ave, Butler, NJ 07405 and is currently estimated at $542,541, approximately $396 per square foot. 2 Cleary Ave is a home located in Morris County with nearby schools including Aaron Decker School, Richard Butler School, and St Anthony Of Padua.
Ownership History
Date
Name
Owned For
Owner Type
Purchase Details
Closed on
Jan 30, 2010
Sold by
Tragna Matida Njie
Bought by
Tragna Matthew W
Current Estimated Value
Home Financials for this Owner
Home Financials are based on the most recent Mortgage that was taken out on this home.
Original Mortgage
$272,000
Outstanding Balance
$180,198
Interest Rate
5.05%
Mortgage Type
New Conventional
Estimated Equity
$362,343
Purchase Details
Closed on
Jun 24, 2004
Sold by
Segreto James
Bought by
Tragna Matthew
Home Financials for this Owner
Home Financials are based on the most recent Mortgage that was taken out on this home.
Original Mortgage
$314,450
Interest Rate
6.3%
Purchase Details
Closed on
May 18, 2000
Sold by
Wyman Joan
Bought by
Segreto James F and Segreto Joy S
Home Financials for this Owner
Home Financials are based on the most recent Mortgage that was taken out on this home.
Original Mortgage
$20,000
Interest Rate
8.1%
Mortgage Type
Credit Line Revolving
Create a Home Valuation Report for This Property
The Home Valuation Report is an in-depth analysis detailing your home's value as well as a comparison with similar homes in the area
Home Values in the Area
Average Home Value in this Area
Purchase History
| Date | Buyer | Sale Price | Title Company |
|---|---|---|---|
| Tragna Matthew W | -- | Colonial Title & Abstract Se | |
| Tragna Matthew | $331,000 | -- | |
| Segreto James F | $199,900 | -- |
Source: Public Records
Mortgage History
| Date | Status | Borrower | Loan Amount |
|---|---|---|---|
| Open | Tragna Matthew W | $272,000 | |
| Closed | Tragna Matthew | $314,450 | |
| Previous Owner | Segreto James F | $20,000 | |
| Previous Owner | Segreto James F | $159,900 |
Source: Public Records
Tax History Compared to Growth
Tax History
| Year | Tax Paid | Tax Assessment Tax Assessment Total Assessment is a certain percentage of the fair market value that is determined by local assessors to be the total taxable value of land and additions on the property. | Land | Improvement |
|---|---|---|---|---|
| 2025 | $9,536 | $402,700 | $239,300 | $163,400 |
| 2024 | $9,724 | $381,900 | $229,300 | $152,600 |
| 2023 | $9,724 | $366,400 | $219,300 | $147,100 |
| 2022 | $7,789 | $336,500 | $199,300 | $137,200 |
| 2021 | $7,789 | $217,900 | $134,800 | $83,100 |
| 2020 | $8,141 | $217,900 | $134,800 | $83,100 |
| 2019 | $8,258 | $226,000 | $134,800 | $91,200 |
| 2018 | $8,152 | $226,000 | $134,800 | $91,200 |
| 2017 | $7,944 | $226,000 | $134,800 | $91,200 |
| 2016 | $7,738 | $226,000 | $134,800 | $91,200 |
| 2015 | $7,614 | $226,000 | $134,800 | $91,200 |
| 2014 | $7,379 | $226,000 | $134,800 | $91,200 |
Source: Public Records
Map
Nearby Homes
- 5 Richard Ct
- 60 Rockcreek Terrace Unit 60
- 68 High St
- 79 Mountainview Ct Unit C79
- 81 Mountainview Ct
- 81 Mountain View Ct Unit 81
- 1 Ogden Terrace
- 7110 Coventry Ct
- 7201 Coventry Ct Unit 201
- 7217 Coventry Ct
- 7306 Coventry Ct Unit 7306
- 6402 Brookhaven Ct Unit 6402
- 6220 Brookhaven Ct Unit 6220
- 141 Boonton Ave
- 114 Bartholdi Ave
- 35 Boonton Ave
- 69 Halina Ln
- 5 Kiel Ave
- 7 Kiel Ave
- 4 Cleary Ave
- 134 Belleview Ave
- 6 Cleary Ave
- 141 Belleview Ave
- 132 Belleview Ave
- 135 Belleview Ave
- 3 Cleary Ave
- 138 Belleview Ave
- 130 Belleview Ave
- 20 Struble Ave
- 8 Cleary Ave
- 126 Belleview Ave
- 140 Belleview Ave
- 14 Struble Ave
- 131 Belleview Ave
- 10 Cleary Ave
- 124 Belleview Ave
- 143 Belleview Ave
- 113 Carey Ave
- 17 Struble Ave