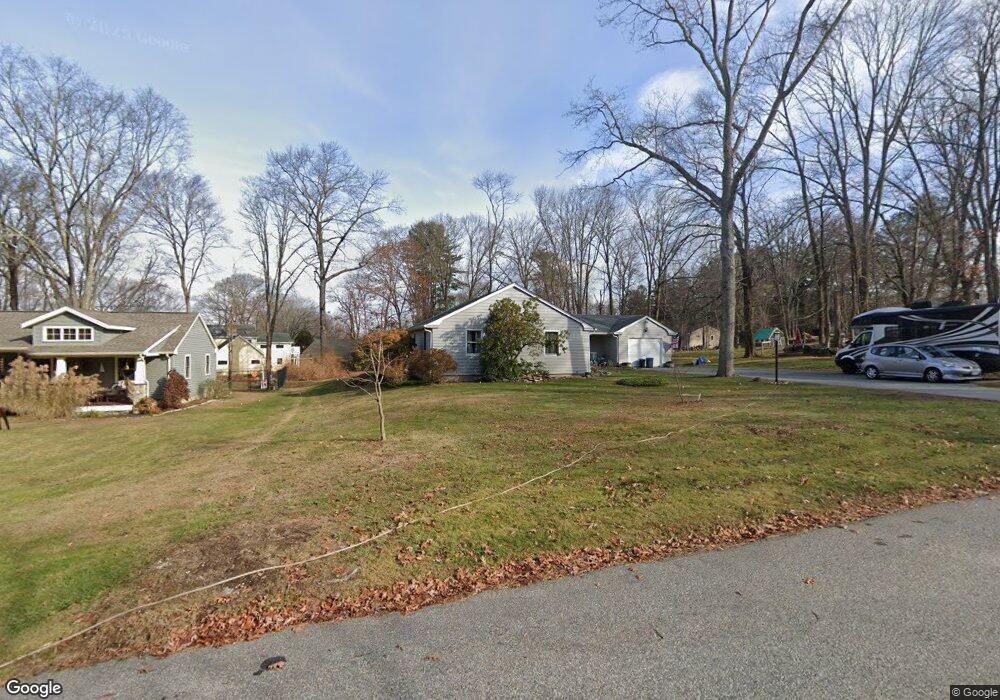
2 Collins Rd Columbia, CT 06237
Estimated Value: $380,099 - $464,000
3
Beds
3
Baths
1,862
Sq Ft
$223/Sq Ft
Est. Value
About This Home
This home is located at 2 Collins Rd, Columbia, CT 06237 and is currently estimated at $415,275, approximately $223 per square foot. 2 Collins Rd is a home located in Tolland County with nearby schools including Horace W. Porter School.
Ownership History
Date
Name
Owned For
Owner Type
Purchase Details
Closed on
Jan 6, 2022
Sold by
Kasica Eugeniusz
Bought by
Kasica Katie
Current Estimated Value
Home Financials for this Owner
Home Financials are based on the most recent Mortgage that was taken out on this home.
Original Mortgage
$156,500
Outstanding Balance
$143,663
Interest Rate
3.12%
Mortgage Type
Purchase Money Mortgage
Estimated Equity
$271,612
Purchase Details
Closed on
Apr 3, 1989
Sold by
Mchugh Thomas
Bought by
Kasica Gene
Home Financials for this Owner
Home Financials are based on the most recent Mortgage that was taken out on this home.
Original Mortgage
$148,000
Interest Rate
10.63%
Mortgage Type
Purchase Money Mortgage
Create a Home Valuation Report for This Property
The Home Valuation Report is an in-depth analysis detailing your home's value as well as a comparison with similar homes in the area
Home Values in the Area
Average Home Value in this Area
Purchase History
| Date | Buyer | Sale Price | Title Company |
|---|---|---|---|
| Kasica Katie | $195,625 | None Available | |
| Kasica Gene | $164,500 | -- |
Source: Public Records
Mortgage History
| Date | Status | Borrower | Loan Amount |
|---|---|---|---|
| Open | Kasica Katie | $156,500 | |
| Previous Owner | Kasica Gene | $188,000 | |
| Previous Owner | Kasica Gene | $139,500 | |
| Previous Owner | Kasica Gene | $148,000 |
Source: Public Records
Tax History Compared to Growth
Tax History
| Year | Tax Paid | Tax Assessment Tax Assessment Total Assessment is a certain percentage of the fair market value that is determined by local assessors to be the total taxable value of land and additions on the property. | Land | Improvement |
|---|---|---|---|---|
| 2025 | $5,178 | $176,890 | $53,060 | $123,830 |
| 2024 | $4,974 | $176,890 | $53,060 | $123,830 |
| 2023 | $4,583 | $176,890 | $53,060 | $123,830 |
| 2022 | $4,576 | $176,890 | $53,060 | $123,830 |
| 2021 | $5,004 | $170,600 | $54,000 | $116,600 |
| 2020 | $5,004 | $170,600 | $54,000 | $116,600 |
| 2019 | $5,004 | $170,600 | $54,000 | $116,600 |
| 2018 | $5,004 | $170,600 | $54,000 | $116,600 |
| 2017 | $4,927 | $170,600 | $54,000 | $116,600 |
| 2016 | $4,481 | $163,300 | $54,000 | $109,300 |
| 2015 | $4,221 | $155,600 | $54,000 | $101,600 |
| 2014 | $4,221 | $155,600 | $54,000 | $101,600 |
Source: Public Records
Map
Nearby Homes