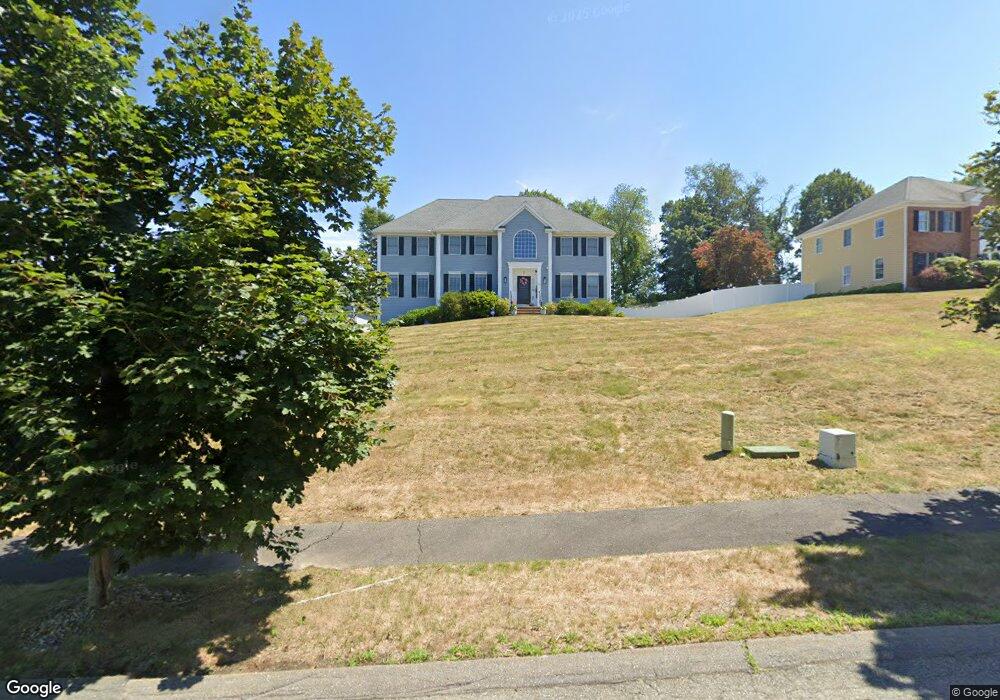
2 Cordoba Dr Danvers, MA 01923
Estimated Value: $1,136,000 - $1,461,000
5
Beds
4
Baths
2,878
Sq Ft
$451/Sq Ft
Est. Value
About This Home
This home is located at 2 Cordoba Dr, Danvers, MA 01923 and is currently estimated at $1,298,267, approximately $451 per square foot. 2 Cordoba Dr is a home located in Essex County with nearby schools including Danvers High School, St. Mary of the Annunciation School, and Plumfield Academy.
Ownership History
Date
Name
Owned For
Owner Type
Purchase Details
Closed on
Jan 10, 2025
Sold by
Moy Eng and Moy Willy
Bought by
Moy Rt and Moy
Current Estimated Value
Purchase Details
Closed on
Apr 29, 2008
Sold by
Rosman Barbara T and Rosman Jerrold L
Bought by
Moy Willy and Moy Eng
Purchase Details
Closed on
Apr 13, 2007
Sold by
Rosman Barbara T and Rosman Jerrold L
Bought by
Rosman Jerrold L
Purchase Details
Closed on
Feb 6, 2001
Sold by
Mccarthy James L and Mccarthy Mary Ann
Bought by
Rosman Jerrold L and Rosman Barbara T
Purchase Details
Closed on
May 28, 1999
Sold by
Cedar Rt and Barbagallo
Bought by
Mccarthy James L and Mccarthy Mary Ann
Purchase Details
Closed on
Nov 24, 1998
Sold by
Cordoba Ricardo
Bought by
Cedar Rt and Barbagallo
Create a Home Valuation Report for This Property
The Home Valuation Report is an in-depth analysis detailing your home's value as well as a comparison with similar homes in the area
Home Values in the Area
Average Home Value in this Area
Purchase History
| Date | Buyer | Sale Price | Title Company |
|---|---|---|---|
| Moy Rt | -- | None Available | |
| Moy Rt | -- | None Available | |
| Moy Willy | $642,200 | -- | |
| Rosman Jerrold L | -- | -- | |
| Rosman Jerrold L | $530,000 | -- | |
| Mccarthy James L | $447,900 | -- | |
| Cedar Rt | $165,000 | -- | |
| Moy Willy | $642,200 | -- | |
| Rosman Jerrold L | -- | -- | |
| Rosman Jerrold L | $530,000 | -- | |
| Mccarthy James L | $447,900 | -- | |
| Cedar Rt | $165,000 | -- |
Source: Public Records
Mortgage History
| Date | Status | Borrower | Loan Amount |
|---|---|---|---|
| Previous Owner | Cedar Rt | $455,000 |
Source: Public Records
Tax History Compared to Growth
Tax History
| Year | Tax Paid | Tax Assessment Tax Assessment Total Assessment is a certain percentage of the fair market value that is determined by local assessors to be the total taxable value of land and additions on the property. | Land | Improvement |
|---|---|---|---|---|
| 2025 | $12,995 | $1,182,400 | $465,200 | $717,200 |
| 2024 | $12,859 | $1,157,400 | $465,200 | $692,200 |
| 2023 | $12,446 | $1,059,200 | $432,200 | $627,000 |
| 2022 | $12,130 | $958,100 | $375,200 | $582,900 |
| 2021 | $11,458 | $858,300 | $345,200 | $513,100 |
| 2020 | $10,445 | $799,800 | $322,700 | $477,100 |
| 2019 | $10,442 | $786,300 | $322,700 | $463,600 |
| 2018 | $10,136 | $748,600 | $319,700 | $428,900 |
| 2017 | $9,744 | $686,700 | $285,200 | $401,500 |
| 2016 | $9,605 | $676,400 | $285,200 | $391,200 |
| 2015 | $9,392 | $629,900 | $262,700 | $367,200 |
Source: Public Records
Map
Nearby Homes
- 103 Newbury St Unit 3
- 98 Newbury St Unit 4B
- 96 Newbury St Unit 6B
- 267 Centre St
- 265 Centre St
- 108 Centre St
- 2 Pat Dr
- 360 Andover St Unit 2101
- 110 Forest St
- 19 Garden St Unit 104
- 171 Hobart St
- 10 Colantoni Dr
- 286 Newbury St Unit 125
- 278 Newbury St Unit 10
- 320 Newbury St Unit 304
- 12 Whipple St
- 261 Newbury St Unit 82c
- 43 Peaslee Cir
- 45 Goodale St
- 31 Peaslee Cir