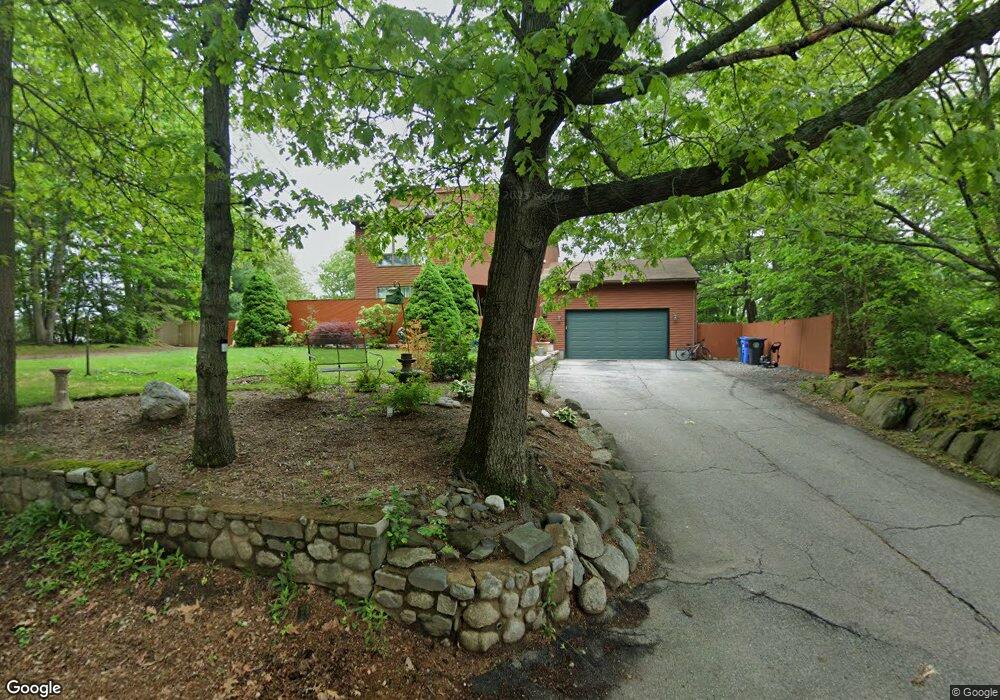
2 Cornell St Cranston, RI 02920
Thornton NeighborhoodEstimated Value: $530,608 - $597,000
3
Beds
2
Baths
1,684
Sq Ft
$333/Sq Ft
Est. Value
About This Home
This home is located at 2 Cornell St, Cranston, RI 02920 and is currently estimated at $560,402, approximately $332 per square foot. 2 Cornell St is a home located in Providence County with nearby schools including George J. Peters School, Western Hills Middle School, and Cranston High School West.
Ownership History
Date
Name
Owned For
Owner Type
Purchase Details
Closed on
Jul 26, 2012
Sold by
Dilorenzo Rosemarie
Bought by
Dilorenzo Dawn and Dilorenzo Rosemarie
Current Estimated Value
Purchase Details
Closed on
Mar 23, 2007
Sold by
Dimuccio Robert D
Bought by
Dilorenzo Dawn
Purchase Details
Closed on
Nov 4, 2003
Sold by
Nogueira Maurice and Ferreira Milton
Bought by
Dimuccio Robert
Purchase Details
Closed on
Apr 29, 2002
Sold by
Defusco William V and Defusco Toniann
Bought by
Nogueira Maurice and Ferreira Millon
Create a Home Valuation Report for This Property
The Home Valuation Report is an in-depth analysis detailing your home's value as well as a comparison with similar homes in the area
Home Values in the Area
Average Home Value in this Area
Purchase History
| Date | Buyer | Sale Price | Title Company |
|---|---|---|---|
| Dilorenzo Dawn | -- | -- | |
| Dilorenzo Dawn | $330,000 | -- | |
| Dimuccio Robert | $272,500 | -- | |
| Nogueira Maurice | $228,000 | -- |
Source: Public Records
Mortgage History
| Date | Status | Borrower | Loan Amount |
|---|---|---|---|
| Open | Nogueira Maurice | $35,000 | |
| Closed | Nogueira Maurice | $25,000 | |
| Previous Owner | Nogueira Maurice | $278,000 |
Source: Public Records
Tax History
| Year | Tax Paid | Tax Assessment Tax Assessment Total Assessment is a certain percentage of the fair market value that is determined by local assessors to be the total taxable value of land and additions on the property. | Land | Improvement |
|---|---|---|---|---|
| 2025 | $6,207 | $447,200 | $133,400 | $313,800 |
| 2024 | $6,086 | $447,200 | $133,400 | $313,800 |
| 2023 | $5,827 | $308,300 | $91,900 | $216,400 |
| 2022 | $5,707 | $308,300 | $91,900 | $216,400 |
| 2021 | $5,549 | $308,300 | $91,900 | $216,400 |
| 2020 | $5,938 | $285,900 | $96,300 | $189,600 |
| 2019 | $5,938 | $285,900 | $96,300 | $189,600 |
| 2018 | $5,801 | $285,900 | $96,300 | $189,600 |
| 2017 | $6,187 | $269,700 | $87,500 | $182,200 |
| 2016 | $6,055 | $269,700 | $87,500 | $182,200 |
| 2015 | $6,055 | $269,700 | $87,500 | $182,200 |
| 2014 | $5,916 | $259,000 | $78,800 | $180,200 |
Source: Public Records
Map
Nearby Homes
- 00 Burton St
- 93 Elena St
- 89R Randall St
- 65 Traymore St
- 89 Randall St
- 44 Valente Dr
- 44 Village Ave
- 83 Valente Dr
- 74 Woodside St
- 77 Rockwood Ave
- 60 Imperial Ave
- 148 Wayland Ave
- 0 Macera Dr
- 0 Clemence St
- 333 Phenix Ave
- 244 Stony Acre Dr
- 71 Norton Ave
- 73 Maple Ave
- 9 Southern St
- 0 Plainfield Pike Unit 1374314
Your Personal Tour Guide
Ask me questions while you tour the home.