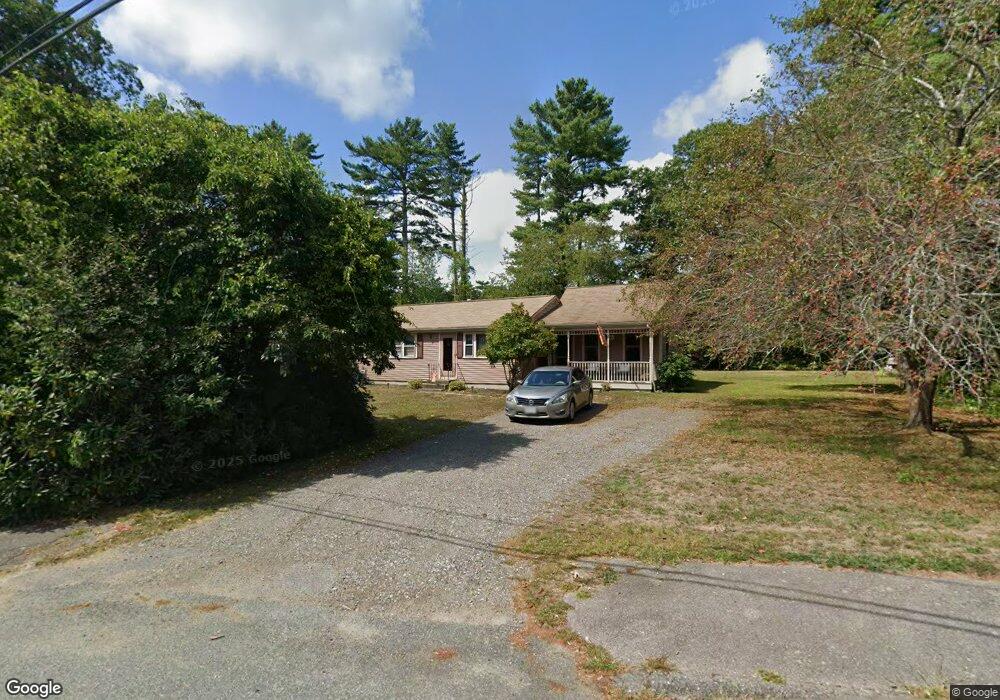
2 Cornish St Carver, MA 02330
Estimated Value: $501,000 - $556,000
3
Beds
1
Bath
1,284
Sq Ft
$413/Sq Ft
Est. Value
About This Home
This home is located at 2 Cornish St, Carver, MA 02330 and is currently estimated at $529,774, approximately $412 per square foot. 2 Cornish St is a home located in Plymouth County with nearby schools including Carver Elementary School, Carver Middle/High School, and Samuel Fuller School.
Ownership History
Date
Name
Owned For
Owner Type
Purchase Details
Closed on
Aug 20, 2015
Sold by
Downing David C and Downing Laurie J
Bought by
Downing David C
Current Estimated Value
Purchase Details
Closed on
Jan 3, 1996
Sold by
Meadows John M and Meadows Charleen M
Bought by
Downing David C and Downing Laurie J
Create a Home Valuation Report for This Property
The Home Valuation Report is an in-depth analysis detailing your home's value as well as a comparison with similar homes in the area
Home Values in the Area
Average Home Value in this Area
Purchase History
| Date | Buyer | Sale Price | Title Company |
|---|---|---|---|
| Downing David C | -- | -- | |
| Downing David C | $109,000 | -- |
Source: Public Records
Mortgage History
| Date | Status | Borrower | Loan Amount |
|---|---|---|---|
| Previous Owner | Downing David C | $245,600 | |
| Previous Owner | Downing David C | $150,000 | |
| Previous Owner | Downing David C | $130,000 | |
| Previous Owner | Downing David C | $21,000 |
Source: Public Records
Tax History
| Year | Tax Paid | Tax Assessment Tax Assessment Total Assessment is a certain percentage of the fair market value that is determined by local assessors to be the total taxable value of land and additions on the property. | Land | Improvement |
|---|---|---|---|---|
| 2025 | $5,910 | $426,100 | $132,500 | $293,600 |
| 2024 | $5,627 | $397,100 | $129,900 | $267,200 |
| 2023 | $5,429 | $372,100 | $129,900 | $242,200 |
| 2022 | $5,114 | $320,000 | $111,100 | $208,900 |
| 2021 | $4,753 | $280,600 | $99,200 | $181,400 |
| 2020 | $4,524 | $263,200 | $92,700 | $170,500 |
| 2019 | $4,399 | $258,000 | $90,000 | $168,000 |
| 2018 | $4,117 | $233,500 | $90,000 | $143,500 |
| 2017 | $3,970 | $224,400 | $86,600 | $137,800 |
| 2016 | $3,650 | $214,300 | $82,400 | $131,900 |
| 2015 | $3,460 | $203,400 | $82,400 | $121,000 |
| 2014 | $3,475 | $204,300 | $104,200 | $100,100 |
Source: Public Records
Map
Nearby Homes
- 40 Fosdick Rd
- 67 Crystal Lake Dr
- 35 Silva St
- 7 Cedar Dr
- 11 Brockton Ave
- 26 Santana Way Unit 26
- 81 Center St
- 89 Silva St
- 235 Main St
- 70 Wall St
- Lot1 Elk Run Dr
- 11 Opal Ave
- 43 S Meadow Rd
- 114 Meadow St
- 6 Susan Cir
- 13 Pond View Way
- 48 S Meadow Village
- 29 S Meadow Village
- 55 S Meadow Village
- 56 Bunnys Rd
Your Personal Tour Guide
Ask me questions while you tour the home.