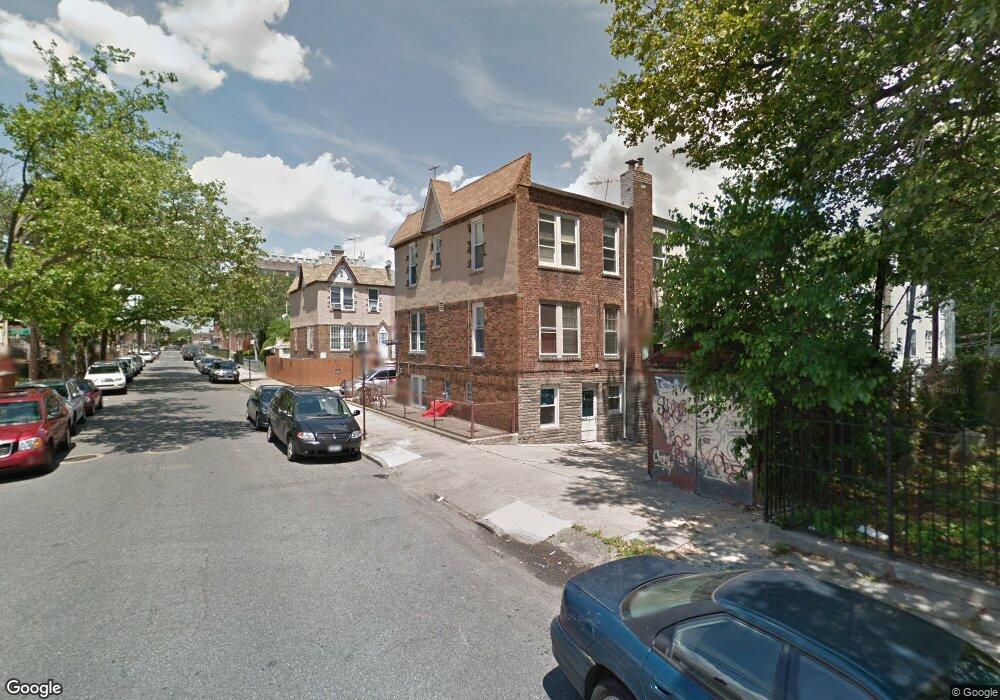
2 Corso Ct Brooklyn, NY 11223
Gravesend NeighborhoodEstimated Value: $974,000 - $1,159,000
Studio
--
Bath
1,836
Sq Ft
$564/Sq Ft
Est. Value
About This Home
This home is located at 2 Corso Ct, Brooklyn, NY 11223 and is currently estimated at $1,035,244, approximately $563 per square foot. 2 Corso Ct is a home located in Kings County with nearby schools including P.S. 95 - The Gravesend, Is 228 David A Boody, and Coney Island Preparatory Public Charter School.
Ownership History
Date
Name
Owned For
Owner Type
Purchase Details
Closed on
Jan 28, 2020
Sold by
Parveen Nusrat
Bought by
2361 H Z Llc
Current Estimated Value
Home Financials for this Owner
Home Financials are based on the most recent Mortgage that was taken out on this home.
Original Mortgage
$512,500
Outstanding Balance
$453,783
Interest Rate
3.6%
Mortgage Type
Unknown
Estimated Equity
$581,461
Purchase Details
Closed on
Apr 19, 2012
Sold by
Estate Of Anna M Velentino
Bought by
Parveen Nusrat
Create a Home Valuation Report for This Property
The Home Valuation Report is an in-depth analysis detailing your home's value as well as a comparison with similar homes in the area
Home Values in the Area
Average Home Value in this Area
Purchase History
| Date | Buyer | Sale Price | Title Company |
|---|---|---|---|
| 2361 H Z Llc | -- | -- | |
| Parveen Nusrat | $350,000 | -- |
Source: Public Records
Mortgage History
| Date | Status | Borrower | Loan Amount |
|---|---|---|---|
| Open | 2361 H Z Llc | $512,500 |
Source: Public Records
Tax History
| Year | Tax Paid | Tax Assessment Tax Assessment Total Assessment is a certain percentage of the fair market value that is determined by local assessors to be the total taxable value of land and additions on the property. | Land | Improvement |
|---|---|---|---|---|
| 2025 | $7,192 | $68,400 | $7,380 | $61,020 |
| 2024 | $7,192 | $60,960 | $7,380 | $53,580 |
| 2023 | $6,861 | $67,920 | $7,380 | $60,540 |
| 2022 | $6,255 | $74,400 | $7,380 | $67,020 |
| 2021 | $6,874 | $57,420 | $7,380 | $50,040 |
| 2020 | $6,695 | $38,160 | $7,380 | $30,780 |
| 2019 | $6,242 | $38,160 | $7,380 | $30,780 |
| 2018 | $5,739 | $28,152 | $4,673 | $23,479 |
| 2017 | $5,624 | $27,588 | $5,042 | $22,546 |
| 2016 | $5,472 | $27,370 | $5,301 | $22,069 |
| 2015 | $2,748 | $26,359 | $7,683 | $18,676 |
| 2014 | $2,748 | $24,867 | $7,504 | $17,363 |
Source: Public Records
Map
Nearby Homes
- 9 Corso Ct
- 222 Avenue V
- 2233 W 5th St
- 104 Village Rd S
- 2113 W 5th St
- 2416 McDonald Ave
- 2154 W 6th St
- 462 Lake St
- 2177 W 7th St
- 472 Lake St
- 71 Village Rd N Unit 3E
- 2055 W 5th St
- 2265 W 7th St Unit 3B
- 76 Lake Place
- 2039 W 5th St
- 67 Stryker St
- 231 Van Sicklen St
- 2151 E 1st St
- 2196 McDonald Ave
- 2166 W 9th St
Your Personal Tour Guide
Ask me questions while you tour the home.