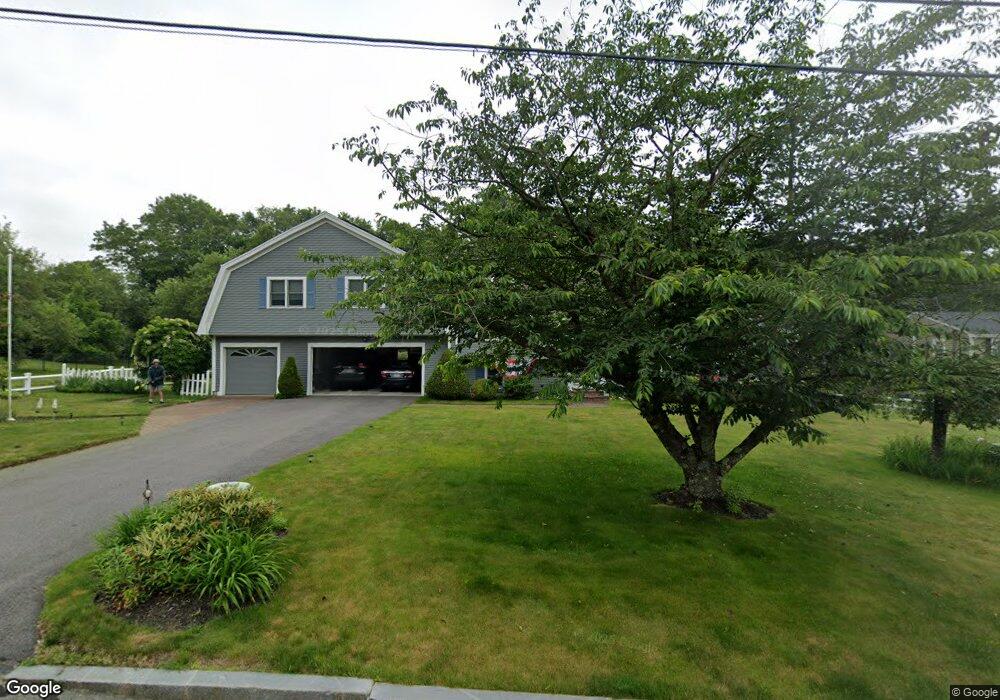
2 Cortland Way West Bridgewater, MA 02379
Estimated Value: $703,458 - $825,000
4
Beds
3
Baths
2,570
Sq Ft
$294/Sq Ft
Est. Value
About This Home
This home is located at 2 Cortland Way, West Bridgewater, MA 02379 and is currently estimated at $755,365, approximately $293 per square foot. 2 Cortland Way is a home located in Plymouth County with nearby schools including Spring Street Elementary School, Howard Elementary School, and Rose L. MacDonald Elementary School.
Ownership History
Date
Name
Owned For
Owner Type
Purchase Details
Closed on
Aug 2, 2018
Sold by
Petit Dennis J and Petit Debra A
Bought by
Petit Ret
Current Estimated Value
Purchase Details
Closed on
Nov 20, 1992
Sold by
Abington Rt
Bought by
Petit Dennis J and Petit Debra A
Create a Home Valuation Report for This Property
The Home Valuation Report is an in-depth analysis detailing your home's value as well as a comparison with similar homes in the area
Home Values in the Area
Average Home Value in this Area
Purchase History
| Date | Buyer | Sale Price | Title Company |
|---|---|---|---|
| Petit Ret | -- | -- | |
| Petit Dennis J | $163,000 | -- |
Source: Public Records
Mortgage History
| Date | Status | Borrower | Loan Amount |
|---|---|---|---|
| Previous Owner | Petit Dennis J | $110,000 | |
| Previous Owner | Petit Dennis J | $160,000 | |
| Previous Owner | Petit Dennis J | $98,000 | |
| Previous Owner | Petit Dennis J | $15,000 |
Source: Public Records
Tax History Compared to Growth
Tax History
| Year | Tax Paid | Tax Assessment Tax Assessment Total Assessment is a certain percentage of the fair market value that is determined by local assessors to be the total taxable value of land and additions on the property. | Land | Improvement |
|---|---|---|---|---|
| 2025 | $8,272 | $605,100 | $232,900 | $372,200 |
| 2024 | $7,842 | $553,400 | $212,500 | $340,900 |
| 2023 | $7,562 | $492,000 | $190,000 | $302,000 |
| 2022 | $7,401 | $456,300 | $181,800 | $274,500 |
| 2021 | $7,259 | $434,400 | $181,800 | $252,600 |
| 2020 | $7,041 | $430,100 | $181,800 | $248,300 |
| 2019 | $6,782 | $410,300 | $181,800 | $228,500 |
| 2018 | $6,512 | $380,800 | $163,400 | $217,400 |
| 2017 | $6,459 | $364,300 | $153,200 | $211,100 |
| 2016 | $6,374 | $354,100 | $143,000 | $211,100 |
| 2015 | $6,258 | $351,400 | $143,000 | $208,400 |
| 2014 | $5,719 | $346,800 | $143,000 | $203,800 |
Source: Public Records
Map
Nearby Homes