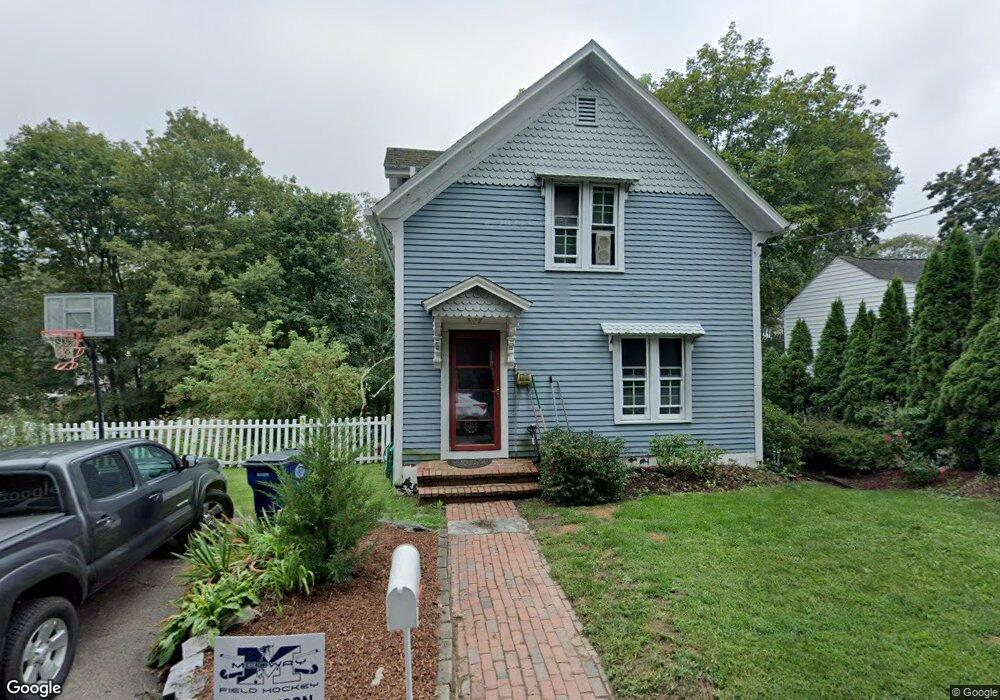
2 Crook St Medway, MA 02053
Estimated Value: $426,000 - $637,000
3
Beds
1
Bath
1,232
Sq Ft
$423/Sq Ft
Est. Value
About This Home
This home is located at 2 Crook St, Medway, MA 02053 and is currently estimated at $521,345, approximately $423 per square foot. 2 Crook St is a home located in Norfolk County with nearby schools including John D. McGovern Elementary School, Burke-Memorial Elementary, and Medway Middle School.
Ownership History
Date
Name
Owned For
Owner Type
Purchase Details
Closed on
Mar 24, 2011
Sold by
Melanson Steven and Melanson Laura Y
Bought by
Melanson Steven
Current Estimated Value
Home Financials for this Owner
Home Financials are based on the most recent Mortgage that was taken out on this home.
Original Mortgage
$172,800
Interest Rate
5.07%
Mortgage Type
Purchase Money Mortgage
Purchase Details
Closed on
Nov 29, 2000
Sold by
Wider Timothy S and Wider Christina E
Bought by
Melanson Steven
Home Financials for this Owner
Home Financials are based on the most recent Mortgage that was taken out on this home.
Original Mortgage
$170,900
Interest Rate
7.76%
Mortgage Type
Purchase Money Mortgage
Create a Home Valuation Report for This Property
The Home Valuation Report is an in-depth analysis detailing your home's value as well as a comparison with similar homes in the area
Home Values in the Area
Average Home Value in this Area
Purchase History
| Date | Buyer | Sale Price | Title Company |
|---|---|---|---|
| Melanson Steven | -- | -- | |
| Melanson Steven | $179,900 | -- |
Source: Public Records
Mortgage History
| Date | Status | Borrower | Loan Amount |
|---|---|---|---|
| Open | Melanson Steven | $171,500 | |
| Closed | Melanson Steven | $172,800 | |
| Previous Owner | Melanson Steven | $160,000 | |
| Previous Owner | Melanson Steven | $170,900 | |
| Previous Owner | Melanson Steven | $122,000 |
Source: Public Records
Tax History Compared to Growth
Tax History
| Year | Tax Paid | Tax Assessment Tax Assessment Total Assessment is a certain percentage of the fair market value that is determined by local assessors to be the total taxable value of land and additions on the property. | Land | Improvement |
|---|---|---|---|---|
| 2025 | $5,768 | $404,800 | $252,200 | $152,600 |
| 2024 | $5,829 | $404,800 | $252,200 | $152,600 |
| 2023 | $5,515 | $346,000 | $209,000 | $137,000 |
| 2022 | $5,284 | $312,100 | $185,500 | $126,600 |
| 2021 | $5,243 | $300,300 | $180,100 | $120,200 |
| 2020 | $4,905 | $280,300 | $160,100 | $120,200 |
| 2019 | $4,699 | $276,900 | $160,100 | $116,800 |
| 2018 | $4,616 | $261,400 | $140,100 | $121,300 |
| 2017 | $4,466 | $249,200 | $130,100 | $119,100 |
| 2016 | $4,426 | $244,400 | $125,300 | $119,100 |
| 2015 | $4,285 | $234,900 | $118,100 | $116,800 |
| 2014 | $4,247 | $225,400 | $124,100 | $101,300 |
Source: Public Records
Map
Nearby Homes