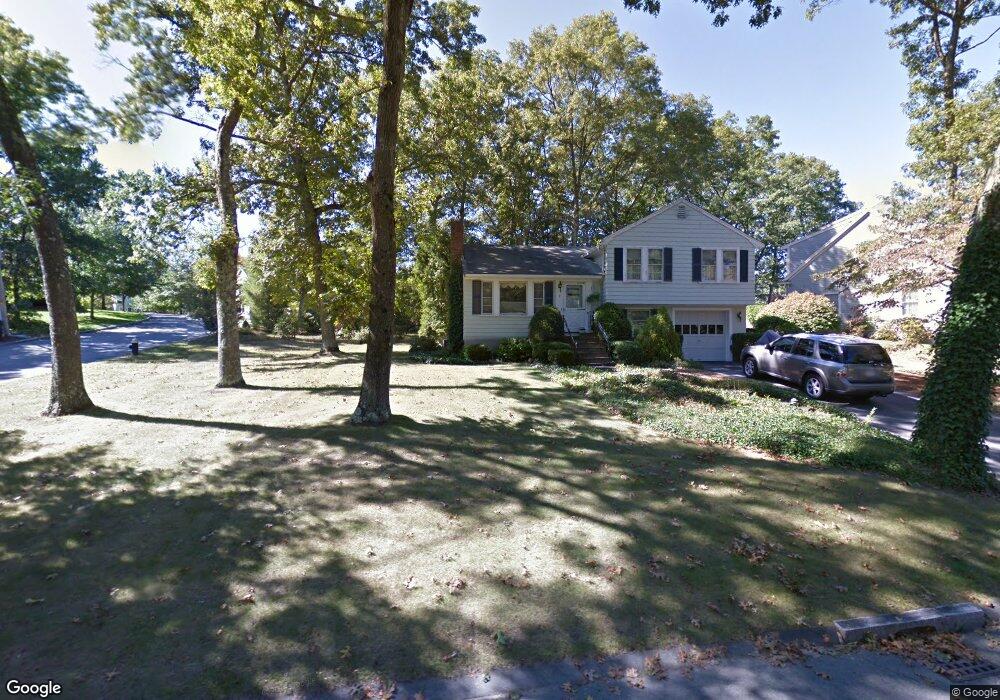
2 Cushing St Lexington, MA 02420
North Lexington NeighborhoodEstimated Value: $2,332,000 - $2,814,000
5
Beds
5
Baths
3,970
Sq Ft
$663/Sq Ft
Est. Value
About This Home
This home is located at 2 Cushing St, Lexington, MA 02420 and is currently estimated at $2,633,206, approximately $663 per square foot. 2 Cushing St is a home located in Middlesex County with nearby schools including Joseph Estabrook Elementary School, William Diamond Middle School, and Lexington High School.
Ownership History
Date
Name
Owned For
Owner Type
Purchase Details
Closed on
Jan 29, 2020
Sold by
Middlesex Development Grp
Bought by
Kakkad Hiren S and Kakkad Hiren
Current Estimated Value
Home Financials for this Owner
Home Financials are based on the most recent Mortgage that was taken out on this home.
Original Mortgage
$1,365,000
Outstanding Balance
$1,211,811
Interest Rate
3.74%
Mortgage Type
Purchase Money Mortgage
Estimated Equity
$1,421,395
Purchase Details
Closed on
Sep 14, 2018
Sold by
Sullivan Thomas J
Bought by
Middlesex Development
Home Financials for this Owner
Home Financials are based on the most recent Mortgage that was taken out on this home.
Original Mortgage
$1,200,000
Interest Rate
4.6%
Mortgage Type
Unknown
Purchase Details
Closed on
Jan 1, 1981
Bought by
Sullivan Thomas J
Create a Home Valuation Report for This Property
The Home Valuation Report is an in-depth analysis detailing your home's value as well as a comparison with similar homes in the area
Home Values in the Area
Average Home Value in this Area
Purchase History
| Date | Buyer | Sale Price | Title Company |
|---|---|---|---|
| Kakkad Hiren S | $1,950,000 | None Available | |
| Middlesex Development | $600,000 | -- | |
| Sullivan Thomas J | -- | -- |
Source: Public Records
Mortgage History
| Date | Status | Borrower | Loan Amount |
|---|---|---|---|
| Open | Kakkad Hiren S | $1,365,000 | |
| Previous Owner | Middlesex Development | $1,200,000 |
Source: Public Records
Tax History
| Year | Tax Paid | Tax Assessment Tax Assessment Total Assessment is a certain percentage of the fair market value that is determined by local assessors to be the total taxable value of land and additions on the property. | Land | Improvement |
|---|---|---|---|---|
| 2025 | $30,220 | $2,471,000 | $846,000 | $1,625,000 |
| 2024 | $29,302 | $2,392,000 | $806,000 | $1,586,000 |
| 2023 | $27,443 | $2,111,000 | $732,000 | $1,379,000 |
| 2022 | $26,717 | $1,936,000 | $666,000 | $1,270,000 |
| 2021 | $26,866 | $1,867,000 | $607,000 | $1,260,000 |
| 2020 | $9,343 | $665,000 | $515,000 | $150,000 |
| 2019 | $9,545 | $676,000 | $490,000 | $186,000 |
| 2018 | $9,281 | $649,000 | $467,000 | $182,000 |
| 2017 | $8,723 | $602,000 | $431,000 | $171,000 |
| 2016 | $8,191 | $561,000 | $410,000 | $151,000 |
| 2015 | $7,831 | $527,000 | $373,000 | $154,000 |
| 2014 | $7,073 | $456,000 | $332,000 | $124,000 |
Source: Public Records
Map
Nearby Homes
- 1 Cushing St
- 83 Winter St
- 37 Pine St
- 48 Shawsheen Rd
- 55 Ivan St
- 24 Donald St
- 23 Dewey Rd
- 10 Bernard St
- 39 Neillian St Unit 39
- 41 Neillian St Unit 41
- 18 Overlook Dr Unit 1
- 18 Robinson Rd
- 18 Hemlock Ln Unit A
- 18 Hemlock Ln Unit B
- 80 Wilson Rd
- 6 Lane Ave
- 63 Dexter Rd
- 28 Hume Rd
- 10 Webber Ave Unit 101
- 10 Webber Ave Unit 102
Your Personal Tour Guide
Ask me questions while you tour the home.