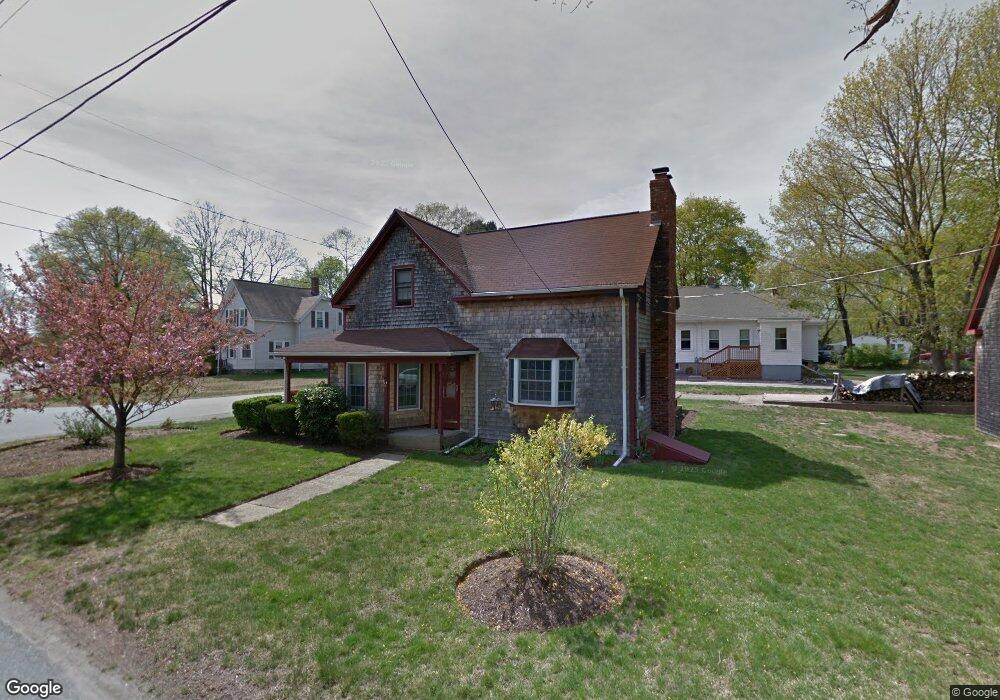
2 Cyr St West Bridgewater, MA 02379
Estimated Value: $520,000 - $586,000
3
Beds
2
Baths
1,400
Sq Ft
$384/Sq Ft
Est. Value
About This Home
This home is located at 2 Cyr St, West Bridgewater, MA 02379 and is currently estimated at $538,218, approximately $384 per square foot. 2 Cyr St is a home located in Plymouth County with nearby schools including Spring Street Elementary School, Howard Elementary School, and Rose L. MacDonald Elementary School.
Ownership History
Date
Name
Owned For
Owner Type
Purchase Details
Closed on
Aug 28, 2008
Sold by
Fhlmc
Bought by
Rodriguez Alejandro A
Current Estimated Value
Home Financials for this Owner
Home Financials are based on the most recent Mortgage that was taken out on this home.
Original Mortgage
$244,800
Outstanding Balance
$161,023
Interest Rate
6.29%
Mortgage Type
Purchase Money Mortgage
Estimated Equity
$377,195
Purchase Details
Closed on
Nov 15, 2007
Sold by
Larson Peter H and Countrywide Home Loans
Bought by
Fhlmc
Purchase Details
Closed on
Apr 3, 2003
Sold by
Larson Peter H
Bought by
Larson Donna M and Larson Peter H
Create a Home Valuation Report for This Property
The Home Valuation Report is an in-depth analysis detailing your home's value as well as a comparison with similar homes in the area
Home Values in the Area
Average Home Value in this Area
Purchase History
| Date | Buyer | Sale Price | Title Company |
|---|---|---|---|
| Rodriguez Alejandro A | $225,000 | -- | |
| Fhlmc | $226,022 | -- | |
| Larson Donna M | -- | -- |
Source: Public Records
Mortgage History
| Date | Status | Borrower | Loan Amount |
|---|---|---|---|
| Open | Larson Donna M | $244,800 | |
| Previous Owner | Larson Donna M | $97,800 |
Source: Public Records
Tax History Compared to Growth
Tax History
| Year | Tax Paid | Tax Assessment Tax Assessment Total Assessment is a certain percentage of the fair market value that is determined by local assessors to be the total taxable value of land and additions on the property. | Land | Improvement |
|---|---|---|---|---|
| 2025 | $6,188 | $452,700 | $199,000 | $253,700 |
| 2024 | $5,876 | $414,700 | $180,400 | $234,300 |
| 2023 | $5,390 | $350,700 | $156,200 | $194,500 |
| 2022 | $5,049 | $311,300 | $146,900 | $164,400 |
| 2021 | $6,563 | $304,700 | $146,900 | $157,800 |
| 2020 | $4,988 | $304,700 | $146,900 | $157,800 |
| 2019 | $5,037 | $304,700 | $146,900 | $157,800 |
| 2018 | $4,877 | $291,900 | $139,500 | $152,400 |
| 2017 | $5,230 | $272,100 | $126,500 | $145,600 |
| 2016 | $4,738 | $263,200 | $117,600 | $145,600 |
| 2015 | $4,746 | $266,500 | $117,600 | $148,900 |
| 2014 | $4,348 | $263,700 | $117,600 | $146,100 |
Source: Public Records
Map
Nearby Homes