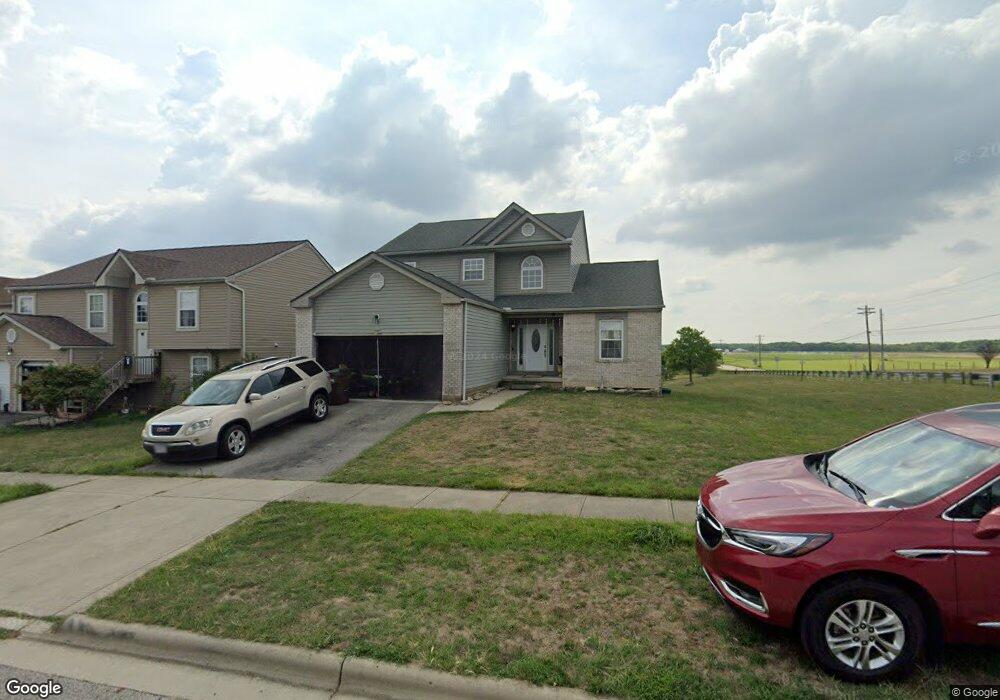
2 Danielson Cir South Bloomfield, OH 43103
Estimated Value: $333,175 - $343,000
3
Beds
2
Baths
1,924
Sq Ft
$176/Sq Ft
Est. Value
About This Home
This home is located at 2 Danielson Cir, South Bloomfield, OH 43103 and is currently estimated at $337,794, approximately $175 per square foot. 2 Danielson Cir is a home located in Pickaway County.
Ownership History
Date
Name
Owned For
Owner Type
Purchase Details
Closed on
Jun 3, 2011
Sold by
Secretary Of Housing & Urban Development
Bought by
Coker Tina
Current Estimated Value
Home Financials for this Owner
Home Financials are based on the most recent Mortgage that was taken out on this home.
Original Mortgage
$100,672
Outstanding Balance
$69,791
Interest Rate
4.75%
Mortgage Type
FHA
Estimated Equity
$268,003
Purchase Details
Closed on
Jun 7, 2010
Sold by
Reed Jimmy J and Case #2008 Ci 712
Bought by
Wells Fargo Bank Na
Purchase Details
Closed on
Mar 10, 2010
Sold by
Wells Fargo Bank Na
Bought by
Secretary Of Housing & Urban Development
Purchase Details
Closed on
Dec 31, 2004
Sold by
Maronda Homes Inc Of Ohio
Bought by
Reed Jimmy J
Home Financials for this Owner
Home Financials are based on the most recent Mortgage that was taken out on this home.
Original Mortgage
$155,558
Interest Rate
5.9%
Mortgage Type
FHA
Create a Home Valuation Report for This Property
The Home Valuation Report is an in-depth analysis detailing your home's value as well as a comparison with similar homes in the area
Home Values in the Area
Average Home Value in this Area
Purchase History
| Date | Buyer | Sale Price | Title Company |
|---|---|---|---|
| Coker Tina | $72,500 | Lakeside Title & Escrow | |
| Wells Fargo Bank Na | $66,667 | Attorney | |
| Secretary Of Housing & Urban Development | -- | None Available | |
| Reed Jimmy J | $158,000 | Chicago Title |
Source: Public Records
Mortgage History
| Date | Status | Borrower | Loan Amount |
|---|---|---|---|
| Open | Coker Tina | $100,672 | |
| Previous Owner | Reed Jimmy J | $155,558 |
Source: Public Records
Tax History Compared to Growth
Tax History
| Year | Tax Paid | Tax Assessment Tax Assessment Total Assessment is a certain percentage of the fair market value that is determined by local assessors to be the total taxable value of land and additions on the property. | Land | Improvement |
|---|---|---|---|---|
| 2024 | -- | $92,840 | $9,700 | $83,140 |
| 2023 | $3,649 | $92,840 | $9,700 | $83,140 |
| 2022 | $2,900 | $68,030 | $8,140 | $59,890 |
| 2021 | $2,753 | $68,030 | $8,140 | $59,890 |
| 2020 | $2,760 | $68,030 | $8,140 | $59,890 |
| 2019 | $2,230 | $57,930 | $8,140 | $49,790 |
| 2018 | $2,452 | $57,930 | $8,140 | $49,790 |
| 2017 | $3,143 | $57,930 | $8,140 | $49,790 |
| 2016 | $2,047 | $46,930 | $8,110 | $38,820 |
| 2015 | $2,048 | $46,930 | $8,110 | $38,820 |
| 2014 | $2,049 | $46,930 | $8,110 | $38,820 |
| 2013 | $2,121 | $46,930 | $8,110 | $38,820 |
Source: Public Records
Map
Nearby Homes
- The Daffodil Plan at Riverbend at Scioto Landing
- The Daisy Plan at Riverbend at Scioto Landing
- The Avalon Plan at Riverbend at Scioto Landing
- The Aster Plan at Riverbend at Scioto Landing
- 51 Henderson Ln
- 0 U S 23
- 127 Boutot St
- Longwood Plan at Walker Pointe
- Birmingham Plan at Walker Pointe
- Sanibel Plan at Walker Pointe
- Carlisle Plan at Walker Pointe
- Somerset Plan at Walker Pointe
- Chattanooga Plan at Walker Pointe
- Rockford Plan at Walker Pointe
- Hoover Plan at Walker Pointe
- Sedona Plan at Walker Pointe
- Truman Plan at Walker Pointe
- Miramar Plan at Walker Pointe
- 5332 Karst Cir
- 5050 S Walnut St
- 4 Danielson Cir
- 6 Danielson Cir
- 1 Danielson Cir
- 8 Danielson Cir
- 3 Danielson Cir
- 5 Danielson Cir
- 5 Danielson Cir Unit 36
- 10 Danielson Cir
- 10 Danielson Cir Unit 5
- 7 Danielson Cir
- 7 Danielson Cir Unit 37
- 12 Danielson Cir
- 9 Danielson Cir
- 9 Danielson Cir Unit 38
- 5041 West St
- 5010 W North St
- 11 Danielson Cir
- 5033 West St
- 14 Danielson Cir
- 5027 West St