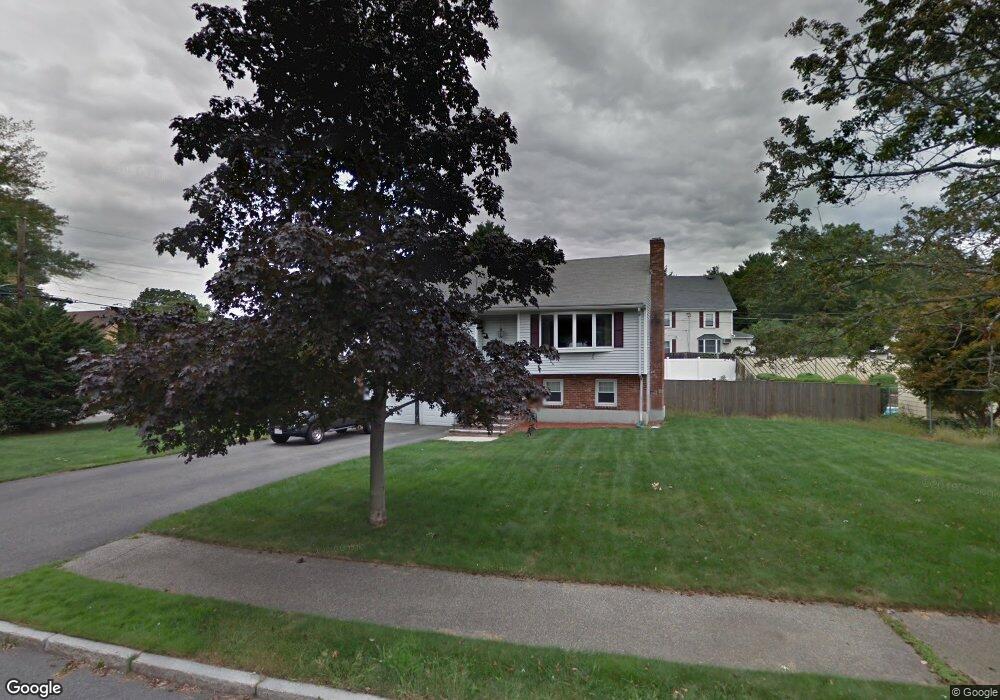
2 Davey Ln Wakefield, MA 01880
Montrose NeighborhoodEstimated Value: $850,000 - $909,000
3
Beds
2
Baths
1,870
Sq Ft
$471/Sq Ft
Est. Value
About This Home
This home is located at 2 Davey Ln, Wakefield, MA 01880 and is currently estimated at $880,072, approximately $470 per square foot. 2 Davey Ln is a home located in Middlesex County with nearby schools including Wakefield Memorial High School, St Joseph School, and Odyssey Day School.
Ownership History
Date
Name
Owned For
Owner Type
Purchase Details
Closed on
Feb 8, 2008
Sold by
Ringenwald Christine
Bought by
Christine M Ringenwald
Current Estimated Value
Purchase Details
Closed on
Apr 27, 1994
Sold by
Santoro Mary and Santoro William D
Bought by
Ringenwald Alfred E and Ringenwald Christine
Home Financials for this Owner
Home Financials are based on the most recent Mortgage that was taken out on this home.
Original Mortgage
$50,000
Interest Rate
7.7%
Mortgage Type
Purchase Money Mortgage
Create a Home Valuation Report for This Property
The Home Valuation Report is an in-depth analysis detailing your home's value as well as a comparison with similar homes in the area
Home Values in the Area
Average Home Value in this Area
Purchase History
| Date | Buyer | Sale Price | Title Company |
|---|---|---|---|
| Christine M Ringenwald | -- | -- | |
| Ringenwald Alfred E | $200,000 | -- |
Source: Public Records
Mortgage History
| Date | Status | Borrower | Loan Amount |
|---|---|---|---|
| Previous Owner | Ringenwald Alfred E | $25,000 | |
| Previous Owner | Ringenwald Alfred E | $50,000 |
Source: Public Records
Tax History
| Year | Tax Paid | Tax Assessment Tax Assessment Total Assessment is a certain percentage of the fair market value that is determined by local assessors to be the total taxable value of land and additions on the property. | Land | Improvement |
|---|---|---|---|---|
| 2025 | $8,506 | $749,400 | $411,300 | $338,100 |
| 2024 | $8,187 | $727,700 | $399,300 | $328,400 |
| 2023 | $7,911 | $674,400 | $369,700 | $304,700 |
| 2022 | $7,562 | $613,800 | $336,100 | $277,700 |
| 2021 | $7,499 | $589,100 | $312,300 | $276,800 |
| 2020 | $7,212 | $564,800 | $299,400 | $265,400 |
| 2019 | $6,996 | $545,300 | $289,000 | $256,300 |
| 2018 | $6,620 | $511,200 | $271,000 | $240,200 |
| 2017 | $6,343 | $486,800 | $258,100 | $228,700 |
| 2016 | $5,965 | $442,200 | $238,500 | $203,700 |
| 2015 | $5,579 | $413,900 | $223,000 | $190,900 |
| 2014 | $5,130 | $401,400 | $216,100 | $185,300 |
Source: Public Records
Map
Nearby Homes
- 68 Preston St Unit 6D
- 410 Salem St Unit 1203
- 16 Pleasant St
- 43-45 Crescent St
- 38 Bennett St Unit 3D
- 29 Cordis St
- 67 Woodcrest Dr
- 0 Everett St
- 395 Vernon St
- 25 Juniper Ave
- 270 Lowell St
- 62 Foundry St Unit 310
- 62 Foundry St Unit 312
- 62 Foundry St Unit 204
- 62 Foundry St Unit 202
- 62 Foundry St Unit 208
- 62 Foundry St Unit 414
- 69 Foundry St Unit 310
- 69 Foundry St Unit 416
- 177 Oak St
Your Personal Tour Guide
Ask me questions while you tour the home.