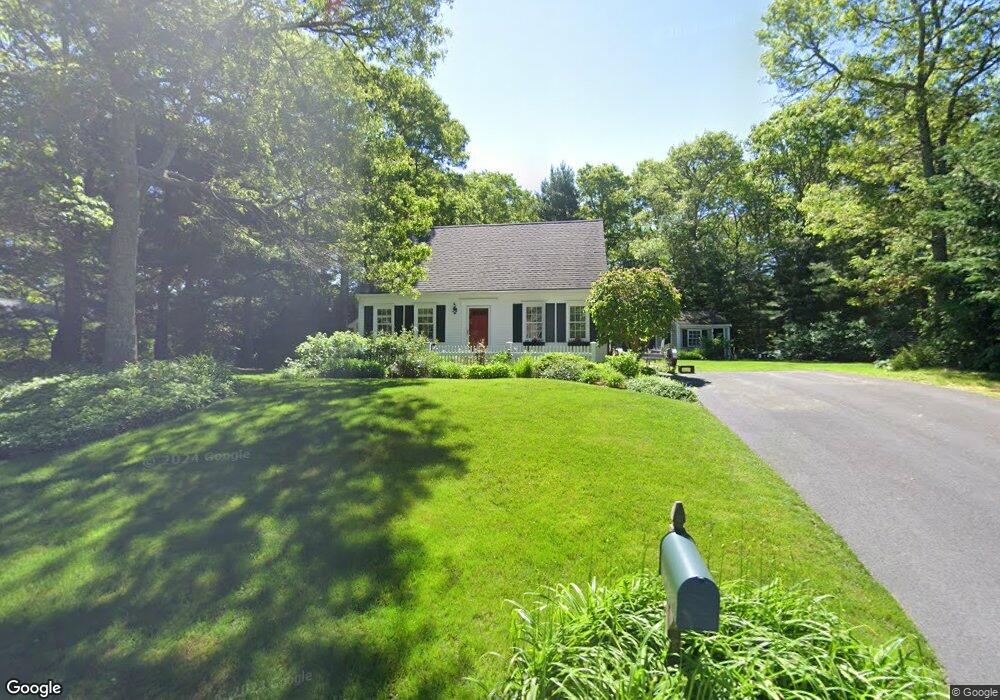
2 Deer Run Ln Sandwich, MA 02563
Estimated Value: $598,000 - $662,000
3
Beds
2
Baths
1,344
Sq Ft
$470/Sq Ft
Est. Value
About This Home
This home is located at 2 Deer Run Ln, Sandwich, MA 02563 and is currently estimated at $631,304, approximately $469 per square foot. 2 Deer Run Ln is a home located in Barnstable County with nearby schools including Sandwich Middle High School, Sandwich Montessori School, and Fair Acres Country Day School.
Ownership History
Date
Name
Owned For
Owner Type
Purchase Details
Closed on
Feb 28, 2000
Sold by
Triple J Rt and Hoban Jacquelyn
Bought by
Greeley Joshua and Greeley Lena K
Current Estimated Value
Home Financials for this Owner
Home Financials are based on the most recent Mortgage that was taken out on this home.
Original Mortgage
$141,000
Interest Rate
8.15%
Mortgage Type
Purchase Money Mortgage
Purchase Details
Closed on
Dec 22, 1999
Sold by
Omerzu Kimberly S and Omerzu Marc J
Bought by
Triple J Rt and Hoban Jacquelyn
Purchase Details
Closed on
Jun 4, 1996
Sold by
Champion Bldrs Inc
Bought by
Omerzu Marc J and Omerzu Kimberly S
Purchase Details
Closed on
Nov 30, 1995
Sold by
Dewar Alan L and Dewar Evelyn H
Bought by
Champion Bldrs Inc
Create a Home Valuation Report for This Property
The Home Valuation Report is an in-depth analysis detailing your home's value as well as a comparison with similar homes in the area
Home Values in the Area
Average Home Value in this Area
Purchase History
| Date | Buyer | Sale Price | Title Company |
|---|---|---|---|
| Greeley Joshua | $157,000 | -- | |
| Triple J Rt | $130,500 | -- | |
| Omerzu Marc J | $119,900 | -- | |
| Champion Bldrs Inc | $30,000 | -- |
Source: Public Records
Mortgage History
| Date | Status | Borrower | Loan Amount |
|---|---|---|---|
| Open | Champion Bldrs Inc | $191,500 | |
| Closed | Champion Bldrs Inc | $190,000 | |
| Closed | Champion Bldrs Inc | $141,000 |
Source: Public Records
Tax History Compared to Growth
Tax History
| Year | Tax Paid | Tax Assessment Tax Assessment Total Assessment is a certain percentage of the fair market value that is determined by local assessors to be the total taxable value of land and additions on the property. | Land | Improvement |
|---|---|---|---|---|
| 2025 | $5,169 | $489,000 | $173,300 | $315,700 |
| 2024 | $4,890 | $452,800 | $154,800 | $298,000 |
| 2023 | $4,720 | $410,400 | $140,700 | $269,700 |
| 2022 | $4,519 | $343,400 | $125,600 | $217,800 |
| 2021 | $4,333 | $314,700 | $120,800 | $193,900 |
| 2020 | $4,320 | $301,900 | $118,000 | $183,900 |
| 2019 | $4,048 | $282,700 | $110,000 | $172,700 |
| 2018 | $3,921 | $274,400 | $111,800 | $162,600 |
| 2017 | $3,885 | $260,200 | $108,200 | $152,000 |
| 2016 | $3,717 | $256,900 | $107,100 | $149,800 |
| 2015 | $3,607 | $243,400 | $96,500 | $146,900 |
Source: Public Records
Map
Nearby Homes