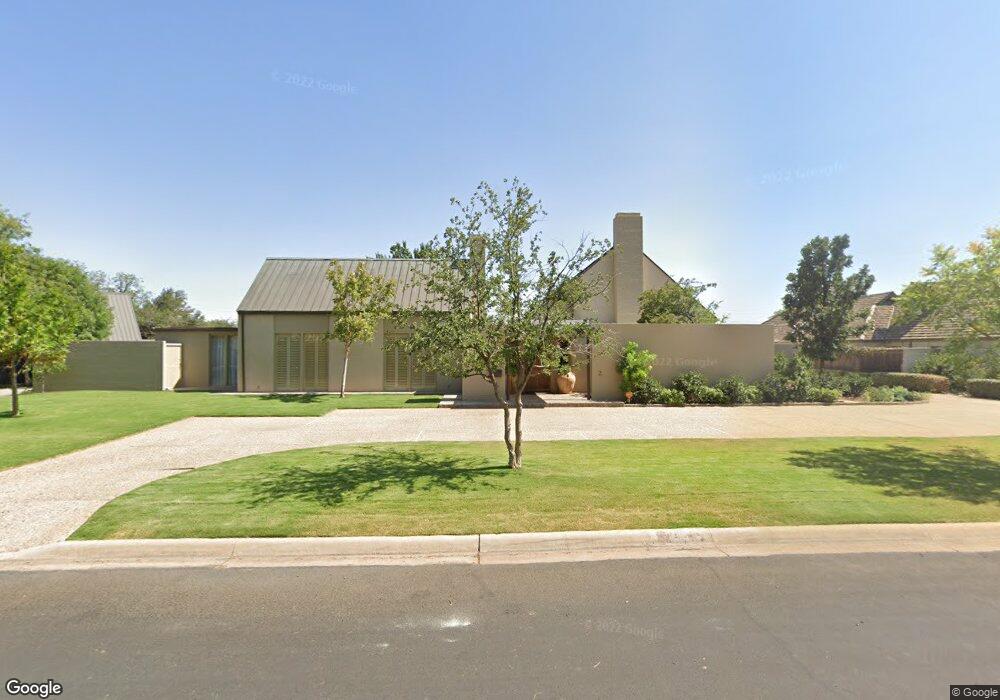
2 Deerfield Dr Midland, TX 79705
Estimated Value: $687,000 - $1,462,000
--
Bed
3
Baths
6,502
Sq Ft
$174/Sq Ft
Est. Value
About This Home
This home is located at 2 Deerfield Dr, Midland, TX 79705 and is currently estimated at $1,131,336, approximately $173 per square foot. 2 Deerfield Dr is a home located in Midland County with nearby schools including Fannin Elementary School, Midland High School, and Milam Elementary School.
Ownership History
Date
Name
Owned For
Owner Type
Purchase Details
Closed on
Oct 1, 1973
Bought by
Beal Barry A
Current Estimated Value
Create a Home Valuation Report for This Property
The Home Valuation Report is an in-depth analysis detailing your home's value as well as a comparison with similar homes in the area
Home Values in the Area
Average Home Value in this Area
Purchase History
| Date | Buyer | Sale Price | Title Company |
|---|---|---|---|
| Beal Barry A | -- | -- |
Source: Public Records
Tax History Compared to Growth
Tax History
| Year | Tax Paid | Tax Assessment Tax Assessment Total Assessment is a certain percentage of the fair market value that is determined by local assessors to be the total taxable value of land and additions on the property. | Land | Improvement |
|---|---|---|---|---|
| 2025 | $6,905 | $1,133,730 | $81,140 | $1,052,590 |
| 2024 | $6,928 | $1,155,140 | $81,140 | $1,074,000 |
| 2023 | $17,103 | $1,141,280 | $81,140 | $1,060,140 |
| 2022 | $18,010 | $1,152,690 | $81,140 | $1,071,550 |
| 2021 | $19,470 | $1,117,570 | $81,140 | $1,036,430 |
| 2020 | $18,662 | $1,105,410 | $81,140 | $1,024,270 |
| 2019 | $18,533 | $978,930 | $81,140 | $1,024,270 |
| 2018 | $17,303 | $889,930 | $81,140 | $993,190 |
| 2017 | $15,730 | $809,030 | $81,140 | $727,890 |
| 2016 | $14,928 | $774,380 | $81,140 | $693,240 |
| 2015 | -- | $774,380 | $81,140 | $693,240 |
| 2014 | -- | $713,580 | $0 | $0 |
Source: Public Records
Map
Nearby Homes
- 2704 N L St
- 2207 Raleigh Point Dr
- 1611 W Pecan Ave
- 1209 W Pecan Ave
- 2609 Mcclintic St
- 2205 Cimmaron Ave
- 2000 Neely Ave
- 2202 Western Dr
- 19 Winchester Ct
- 2109 Western Dr
- 2603 Hodges St
- 907 Shirley Ct
- 2105 Oaklawn Dr
- 2400 W Dengar Ave
- 2016 Gulf Prairie Ln
- 2305 Auburn Place
- 806 Stanolind Ave
- 2406 Dartmouth Dr
- 6 Lafayette Place
- 1602 Winfield Rd
- 1 Deerfield Dr
- 1608 W Dengar Ave
- 3 Deerfield Dr
- 1610 W Dengar Ave
- 1606 W Dengar Ave
- 6 Deerfield Dr
- 1612 W Dengar Ave
- 5 Deerfield Dr
- 1604 W Dengar Ave
- 3200 Racquet Club Dr
- 3008 Racquet Club Dr
- 1602 W Dengar Ave
- 1614 W Dengar Ave
- 2 Greenwich Dr
- 1609 W Dengar Ave
- 3 Greenwich Dr
- 1611 W Dengar Ave
- 3201 N I St
- 3203 N I St
- 1607 W Dengar Ave