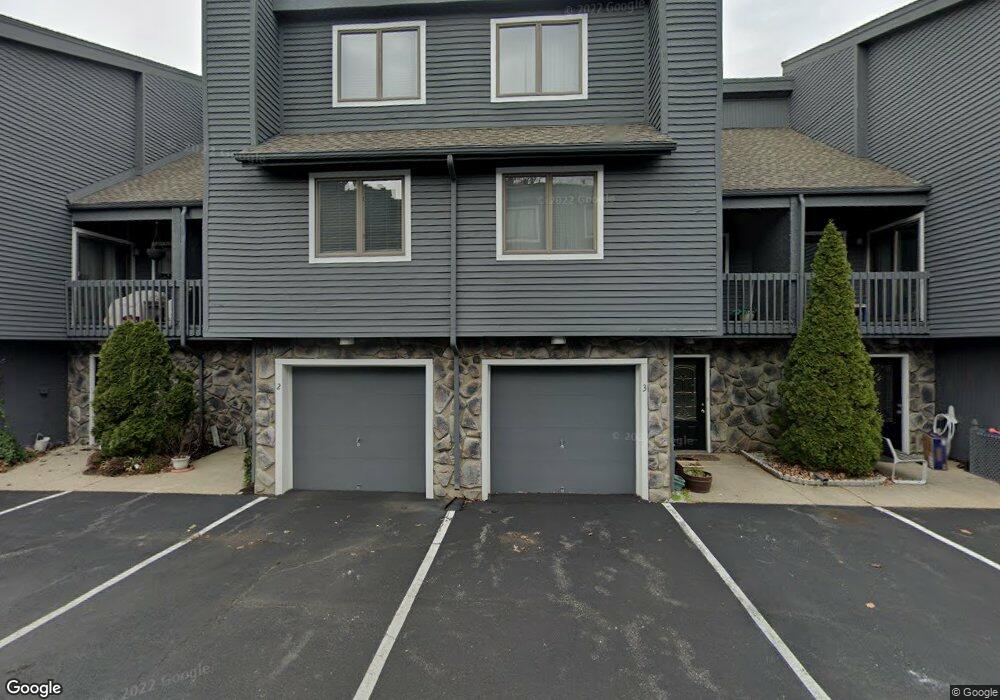
2 Devon Ct Spring Lake, NJ 07762
Estimated Value: $693,000 - $803,000
2
Beds
2
Baths
1,784
Sq Ft
$415/Sq Ft
Est. Value
About This Home
This home is located at 2 Devon Ct, Spring Lake, NJ 07762 and is currently estimated at $739,876, approximately $414 per square foot. 2 Devon Ct is a home located in Monmouth County with nearby schools including Spring Lake Heights Elementary School, St. Catharine School, and St Rose High School.
Ownership History
Date
Name
Owned For
Owner Type
Purchase Details
Closed on
Jul 31, 1996
Sold by
Cacicedo Paul
Bought by
Compoli Arlene
Current Estimated Value
Home Financials for this Owner
Home Financials are based on the most recent Mortgage that was taken out on this home.
Original Mortgage
$100,000
Outstanding Balance
$7,926
Interest Rate
8.24%
Estimated Equity
$731,950
Create a Home Valuation Report for This Property
The Home Valuation Report is an in-depth analysis detailing your home's value as well as a comparison with similar homes in the area
Home Values in the Area
Average Home Value in this Area
Purchase History
| Date | Buyer | Sale Price | Title Company |
|---|---|---|---|
| Compoli Arlene | $145,000 | -- |
Source: Public Records
Mortgage History
| Date | Status | Borrower | Loan Amount |
|---|---|---|---|
| Open | Compoli Arlene | $100,000 |
Source: Public Records
Tax History
| Year | Tax Paid | Tax Assessment Tax Assessment Total Assessment is a certain percentage of the fair market value that is determined by local assessors to be the total taxable value of land and additions on the property. | Land | Improvement |
|---|---|---|---|---|
| 2025 | $6,190 | $614,500 | $425,000 | $189,500 |
| 2024 | $5,979 | $587,800 | $401,800 | $186,000 |
| 2023 | $5,979 | $533,800 | $350,000 | $183,800 |
| 2022 | $5,203 | $431,400 | $178,000 | $253,400 |
| 2021 | $5,203 | $385,400 | $155,000 | $230,400 |
| 2020 | $4,944 | $364,100 | $155,000 | $209,100 |
| 2019 | $4,915 | $358,200 | $155,000 | $203,200 |
| 2018 | $4,833 | $342,800 | $155,000 | $187,800 |
| 2017 | $4,631 | $340,500 | $155,000 | $185,500 |
| 2016 | $5,620 | $408,100 | $225,000 | $183,100 |
| 2015 | $5,539 | $403,400 | $225,000 | $178,400 |
| 2014 | $5,200 | $387,200 | $210,000 | $177,200 |
Source: Public Records
Map
Nearby Homes
- 217 Pitney Ave
- 420 Ludlow Ave
- 809 Wall Rd
- 2208 2nd Ave
- 1805 Margerum Ave
- 815 Woodcrest Dr
- 207 Tuttle Ave
- 2 Seawood Way
- 1850 Fernwood Rd
- 708 18th Ave
- 1809 Fernwood Rd
- 1726 M St
- 1812 Fernwood Rd Unit 2
- 23 Locust Way
- 206 Brighton Ave
- 2419 Kipling Ave
- 1731 Grove St
- 16 Cherry Ct
- 520 18th Ave
- 108 Howell Ave
Your Personal Tour Guide
Ask me questions while you tour the home.