2 Dix St Townsend, MA 01469
Estimated Value: $423,000 - $563,000
3
Beds
2
Baths
2,156
Sq Ft
$219/Sq Ft
Est. Value
About This Home
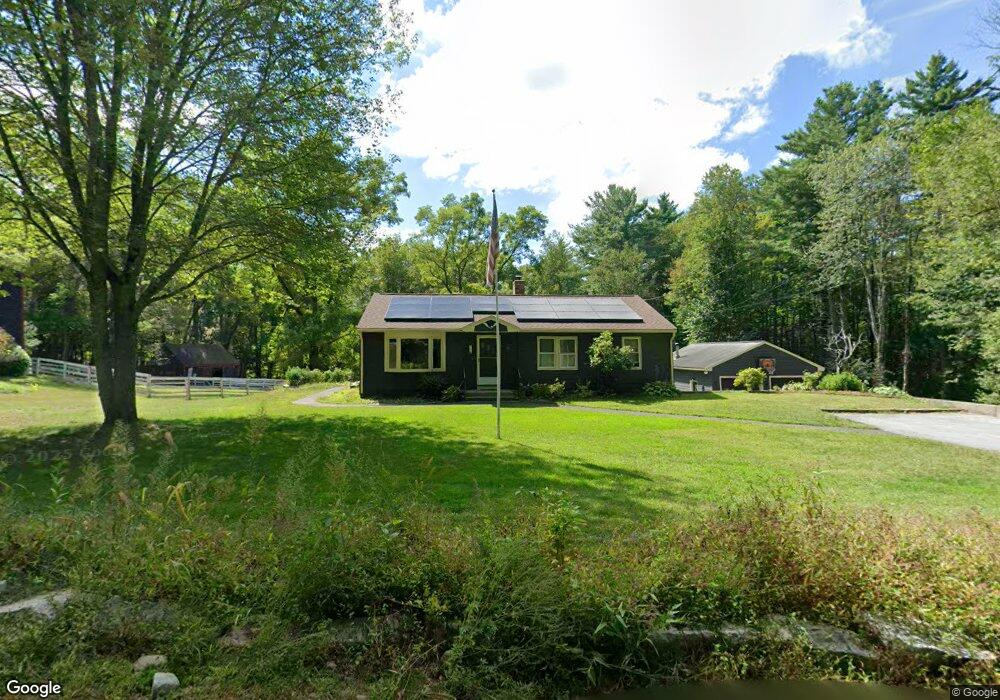
This home is located at 2 Dix St, Townsend, MA 01469 and is currently estimated at $472,810, approximately $219 per square foot. 2 Dix St is a home located in Middlesex County with nearby schools including North Middlesex Regional High School.
Ownership History
Date
Name
Owned For
Owner Type
Purchase Details
Closed on
Dec 9, 2020
Sold by
Staples Jean E
Bought by
Staples Jean E and Staples Richard C
Current Estimated Value
Home Financials for this Owner
Home Financials are based on the most recent Mortgage that was taken out on this home.
Original Mortgage
$172,000
Outstanding Balance
$152,620
Interest Rate
2.8%
Mortgage Type
New Conventional
Estimated Equity
$320,190
Purchase Details
Closed on
Jun 12, 2018
Sold by
Dickerson John H Est and Staples
Bought by
Staples Jean E
Create a Home Valuation Report for This Property
The Home Valuation Report is an in-depth analysis detailing your home's value as well as a comparison with similar homes in the area
Home Values in the Area
Average Home Value in this Area
Purchase History
| Date | Buyer | Sale Price | Title Company |
|---|---|---|---|
| Staples Jean E | -- | None Available | |
| Staples Jean E | -- | -- |
Source: Public Records
Mortgage History
| Date | Status | Borrower | Loan Amount |
|---|---|---|---|
| Open | Staples Jean E | $172,000 |
Source: Public Records
Tax History
| Year | Tax Paid | Tax Assessment Tax Assessment Total Assessment is a certain percentage of the fair market value that is determined by local assessors to be the total taxable value of land and additions on the property. | Land | Improvement |
|---|---|---|---|---|
| 2025 | $5,156 | $355,100 | $96,500 | $258,600 |
| 2024 | $5,061 | $351,200 | $96,500 | $254,700 |
| 2023 | $4,679 | $306,600 | $87,800 | $218,800 |
| 2022 | $4,774 | $271,100 | $76,200 | $194,900 |
| 2021 | $4,923 | $268,600 | $75,400 | $193,200 |
| 2020 | $4,736 | $242,600 | $66,800 | $175,800 |
| 2019 | $4,664 | $241,300 | $66,800 | $174,500 |
| 2018 | $4,510 | $222,600 | $67,000 | $155,600 |
| 2017 | $4,302 | $218,700 | $71,300 | $147,400 |
| 2016 | $4,027 | $203,400 | $71,300 | $132,100 |
| 2015 | $4,000 | $209,300 | $74,400 | $134,900 |
| 2014 | $3,693 | $188,700 | $67,000 | $121,700 |
Source: Public Records
Map
Nearby Homes
- 0 Brookline St
- 364 Townsend Hill Rd
- 5 Turnpike Rd Unit 213 TWO
- 1 Depot Street Extension Unit 5
- 1 Depot Street Extension Unit 2
- 1 Depot Street Extension Unit 4
- 16 Worcester Rd
- 359 Main St
- 198 N End Rd
- 9 Kaneohe Ct
- 18 Beech St
- 143 Heald St
- 2 Blueberry Hill Rd
- 6 High Oaks Path
- 1235 Townsend Rd
- 86 W Elm Lunenburg Rd Blood Rd
- 9 Winterberry Rd
- 7 Winterberry Rd
- 9 Quigley Way
- 43 Shattuck St
Your Personal Tour Guide
Ask me questions while you tour the home.