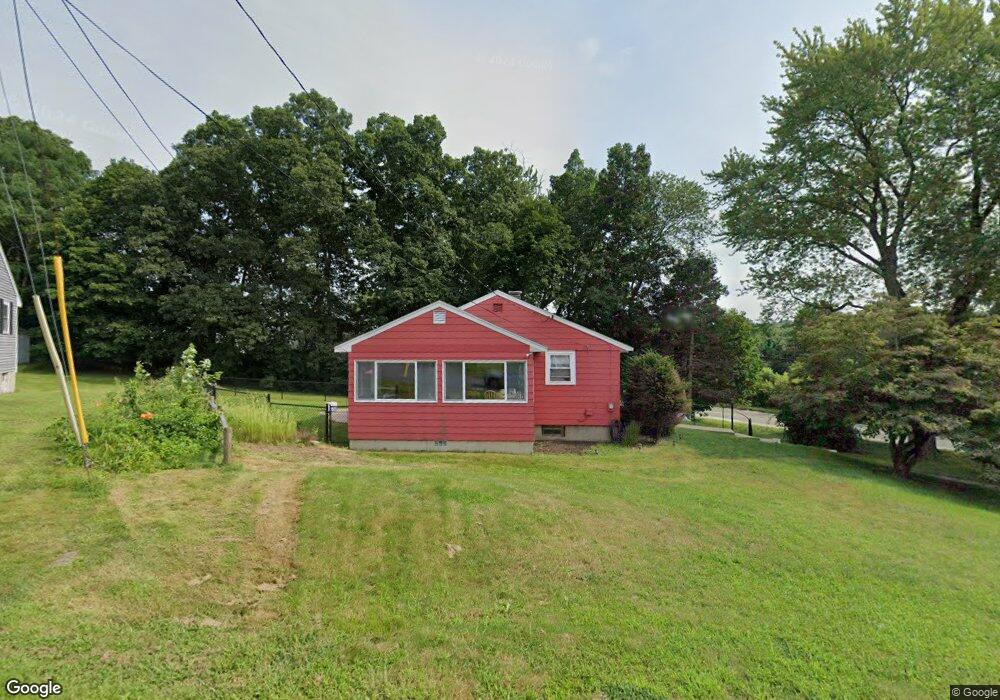
2 Duncan Rd Burlington, MA 01803
Burlington Town Center NeighborhoodEstimated Value: $666,000 - $900,000
3
Beds
1
Bath
1,104
Sq Ft
$691/Sq Ft
Est. Value
About This Home
This home is located at 2 Duncan Rd, Burlington, MA 01803 and is currently estimated at $762,524, approximately $690 per square foot. 2 Duncan Rd is a home located in Middlesex County with nearby schools including Burlington High School, Memorial Elementary School, and Marshall Simonds Middle School.
Ownership History
Date
Name
Owned For
Owner Type
Purchase Details
Closed on
Jul 29, 2011
Sold by
Couture Catherine M and Verville Catherine M
Bought by
Martino Jennifer and Ministeri Michelle
Current Estimated Value
Home Financials for this Owner
Home Financials are based on the most recent Mortgage that was taken out on this home.
Original Mortgage
$259,743
Outstanding Balance
$179,423
Interest Rate
4.52%
Mortgage Type
Purchase Money Mortgage
Estimated Equity
$583,101
Purchase Details
Closed on
Jun 1, 2009
Sold by
Couture Catherine M
Bought by
Verville Catherine Mary and Martel Mare
Create a Home Valuation Report for This Property
The Home Valuation Report is an in-depth analysis detailing your home's value as well as a comparison with similar homes in the area
Home Values in the Area
Average Home Value in this Area
Purchase History
| Date | Buyer | Sale Price | Title Company |
|---|---|---|---|
| Martino Jennifer | $266,500 | -- | |
| Verville Catherine Mary | -- | -- |
Source: Public Records
Mortgage History
| Date | Status | Borrower | Loan Amount |
|---|---|---|---|
| Open | Martino Jennifer | $259,743 |
Source: Public Records
Tax History Compared to Growth
Tax History
| Year | Tax Paid | Tax Assessment Tax Assessment Total Assessment is a certain percentage of the fair market value that is determined by local assessors to be the total taxable value of land and additions on the property. | Land | Improvement |
|---|---|---|---|---|
| 2025 | $4,408 | $509,000 | $343,900 | $165,100 |
| 2024 | $4,168 | $466,200 | $317,200 | $149,000 |
| 2023 | $3,956 | $420,900 | $275,100 | $145,800 |
| 2022 | $3,912 | $393,200 | $254,100 | $139,100 |
| 2021 | $7,924 | $369,700 | $230,600 | $139,100 |
| 2020 | $3,524 | $365,600 | $226,500 | $139,100 |
| 2019 | $3,293 | $314,200 | $206,300 | $107,900 |
| 2018 | $6,534 | $300,200 | $196,600 | $103,600 |
| 2017 | $3,120 | $300,200 | $196,600 | $103,600 |
| 2016 | $3,091 | $269,700 | $169,900 | $99,800 |
| 2015 | $3,150 | $277,500 | $169,900 | $107,600 |
| 2014 | $3,196 | $266,300 | $161,800 | $104,500 |
Source: Public Records
Map
Nearby Homes
- 94 Center St
- 137 Winn St
- 4 Ardmore Ave
- 29 Overlook Ave
- 61 Villagewood Dr
- 29 Grove Ln Unit 29
- 50 Hill Cir
- 12 Maple Ridge Dr
- 5 Maple Ridge Dr Unit 5
- 112 Pearl St Unit B
- 17 Sunnyside Rd
- 16 Sunnyside Rd
- 6 Kendal Dr
- 210 Winn St
- 129 Cambridge St Unit 1
- 19 Quimby Ave
- 9 Pilgrim Rd
- 6 Tidd Ave
- 846 Main St
- 42 Mill St