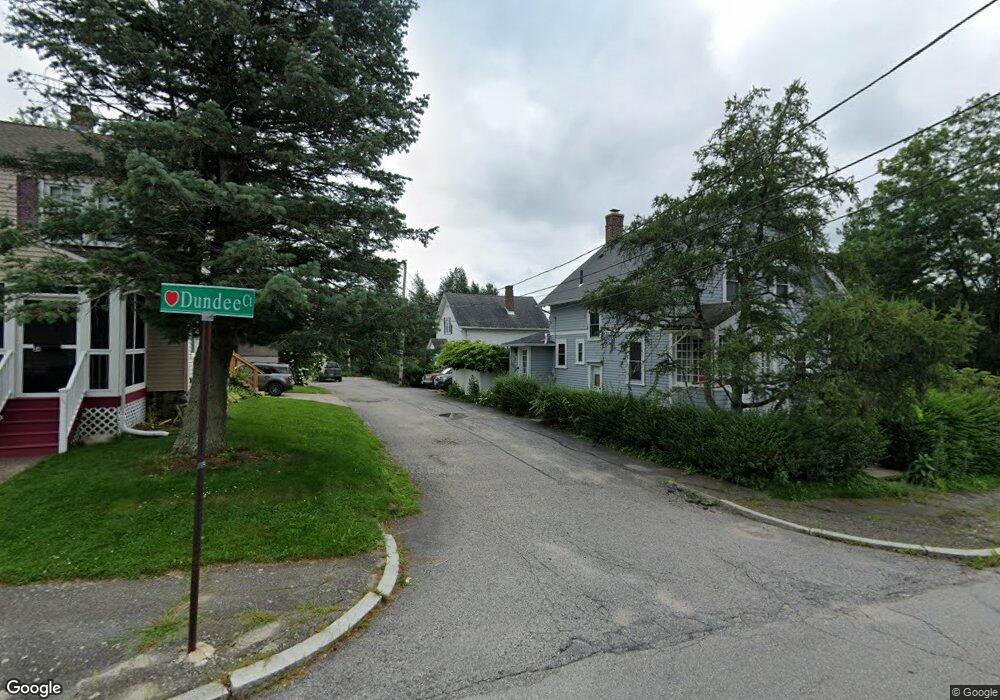
2 Dundee Ct Worcester, MA 01606
Greendale NeighborhoodEstimated Value: $412,000 - $473,000
4
Beds
2
Baths
1,411
Sq Ft
$311/Sq Ft
Est. Value
About This Home
This home is located at 2 Dundee Ct, Worcester, MA 01606 and is currently estimated at $438,730, approximately $310 per square foot. 2 Dundee Ct is a home located in Worcester County with nearby schools including Belmont Street Community School, Jacob Hiatt Magnet School, and Chandler Magnet.
Ownership History
Date
Name
Owned For
Owner Type
Purchase Details
Closed on
Sep 13, 2017
Sold by
Jordan Cathleen and Jordan Ellen J
Bought by
Zalauskas Carl and Rose Katrina
Current Estimated Value
Home Financials for this Owner
Home Financials are based on the most recent Mortgage that was taken out on this home.
Original Mortgage
$168,905
Outstanding Balance
$137,367
Interest Rate
3.93%
Mortgage Type
FHA
Estimated Equity
$301,363
Create a Home Valuation Report for This Property
The Home Valuation Report is an in-depth analysis detailing your home's value as well as a comparison with similar homes in the area
Home Values in the Area
Average Home Value in this Area
Purchase History
| Date | Buyer | Sale Price | Title Company |
|---|---|---|---|
| Zalauskas Carl | $185,000 | -- |
Source: Public Records
Mortgage History
| Date | Status | Borrower | Loan Amount |
|---|---|---|---|
| Open | Zalauskas Carl | $168,905 |
Source: Public Records
Tax History
| Year | Tax Paid | Tax Assessment Tax Assessment Total Assessment is a certain percentage of the fair market value that is determined by local assessors to be the total taxable value of land and additions on the property. | Land | Improvement |
|---|---|---|---|---|
| 2025 | $4,841 | $367,000 | $119,100 | $247,900 |
| 2024 | $4,659 | $338,800 | $119,100 | $219,700 |
| 2023 | $4,470 | $311,700 | $103,500 | $208,200 |
| 2022 | $4,114 | $270,500 | $82,800 | $187,700 |
| 2021 | $3,967 | $243,700 | $66,300 | $177,400 |
| 2020 | $3,796 | $223,300 | $66,200 | $157,100 |
| 2019 | $3,658 | $203,200 | $59,800 | $143,400 |
| 2018 | $3,661 | $193,600 | $59,800 | $133,800 |
| 2017 | $3,519 | $183,100 | $59,800 | $123,300 |
| 2016 | $3,485 | $169,100 | $44,700 | $124,400 |
| 2015 | $3,394 | $169,100 | $44,700 | $124,400 |
| 2014 | $3,304 | $169,100 | $44,700 | $124,400 |
Source: Public Records
Map
Nearby Homes
- 93 Blue Bell Rd
- 30 Danielles Way
- 18 Danielles Way
- 4 Winston Rd
- 53 Mount Ave
- 10 Malden St
- 331 Burncoat St
- 328 Brooks St
- 96 Uncatena Ave
- 36 Sunrise Ave
- 94 Kendrick Ave
- 63 Cobblestone Ln Unit 63
- 31 Enaya Cir Unit 31
- 169 Whitmarsh Ave
- 101 Ararat St
- 58 Osceola Ave
- 248 Saint Nicholas Ave
- 10 Beale St
- 12 Beale St
- 16 Beale St
Your Personal Tour Guide
Ask me questions while you tour the home.