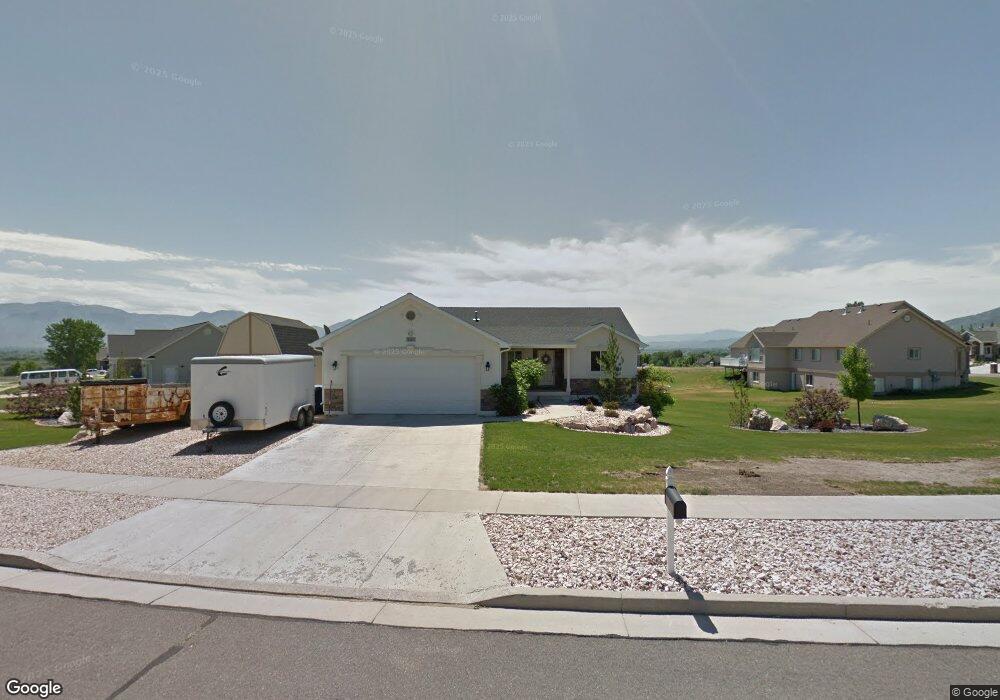
2 E 600 N Mendon, UT 84325
Estimated Value: $589,000 - $747,000
Studio
--
Bath
1,556
Sq Ft
$434/Sq Ft
Est. Value
About This Home
This home is located at 2 E 600 N, Mendon, UT 84325 and is currently estimated at $675,261, approximately $433 per square foot. 2 E 600 N is a home with nearby schools including Mountainside School, South Cache Middle School, and Mountain Crest High School.
Ownership History
Date
Name
Owned For
Owner Type
Purchase Details
Closed on
Feb 22, 2006
Sold by
Croshaw John
Bought by
Croshaw John and Croshaw Gloria
Current Estimated Value
Home Financials for this Owner
Home Financials are based on the most recent Mortgage that was taken out on this home.
Original Mortgage
$186,400
Outstanding Balance
$104,025
Interest Rate
6.15%
Mortgage Type
New Conventional
Estimated Equity
$571,236
Purchase Details
Closed on
May 19, 2005
Sold by
Pheasant Hollow Development Llc
Bought by
Croshaw John and Croshaw Gloria
Home Financials for this Owner
Home Financials are based on the most recent Mortgage that was taken out on this home.
Original Mortgage
$156,000
Interest Rate
5.87%
Mortgage Type
Purchase Money Mortgage
Create a Home Valuation Report for This Property
The Home Valuation Report is an in-depth analysis detailing your home's value as well as a comparison with similar homes in the area
Purchase History
| Date | Buyer | Sale Price | Title Company |
|---|---|---|---|
| Croshaw John | -- | Northern Title Company | |
| Croshaw John | -- | Northern Title Company | |
| Croshaw John | -- | Cache Title Company |
Source: Public Records
Mortgage History
| Date | Status | Borrower | Loan Amount |
|---|---|---|---|
| Open | Croshaw John | $186,400 | |
| Closed | Croshaw John | $156,000 |
Source: Public Records
Tax History
| Year | Tax Paid | Tax Assessment Tax Assessment Total Assessment is a certain percentage of the fair market value that is determined by local assessors to be the total taxable value of land and additions on the property. | Land | Improvement |
|---|---|---|---|---|
| 2025 | $2,646 | $350,110 | $0 | $0 |
| 2024 | $2,823 | $350,110 | $0 | $0 |
| 2023 | $2,781 | $327,670 | $0 | $0 |
| 2022 | $2,800 | $327,675 | $0 | $0 |
| 2021 | $2,662 | $467,815 | $100,000 | $367,815 |
| 2020 | $2,092 | $340,331 | $70,000 | $270,331 |
| 2019 | $2,205 | $340,330 | $70,000 | $270,330 |
| 2018 | $1,984 | $305,070 | $70,000 | $235,070 |
| 2017 | $1,936 | $156,035 | $0 | $0 |
| 2016 | $1,914 | $152,185 | $0 | $0 |
| 2015 | $1,567 | $126,765 | $0 | $0 |
| 2014 | $1,530 | $126,765 | $0 | $0 |
| 2013 | -- | $126,765 | $0 | $0 |
Source: Public Records
Map
Nearby Homes
- 54 W 200 N
- 2500 S 6400 W
- 6770 W 400 S
- 876 N 75 W Unit 9
- 967 N 75 W Unit 63
- 59 W 1050 N Unit 18
- 993 N 75 W Unit 64
- 948 N 75 W Unit 11
- 42 W 850 N Unit 5
- 1044 N 75 W Unit 15
- 850 N 51 W Unit 59
- 915 N 75 W Unit 61
- 850 N 73 W Unit 60
- 26 W 850 N Unit 4
- 1045 N 75 W Unit 66
- 1052 N 75 W Unit 16
- 996 N 75 W Unit 13
- 972 N 75 W Unit 12
- 924 N 75 W Unit 10
- 1020 N 75 W Unit 14
- 570 Pheasant Hollow Ln
- 8 E 600 N
- 7 E 600 N
- 5 E 600 N
- 595 N Pheasant Hollow Ln W Unit 64
- 26 E 600 N
- 565 Pheasant Hollow Ln
- 17 E 600 N
- 575 Pheasant Hollow Ln
- 555 Pheasant Hollow Ln
- 550 Pheasant Hollow Ln
- 17 W W 0700 N N
- 540 Pheasant Hollow Ln
- 44 E 600 N
- 35 E 600 N
- 25 W 700 N
- 545 Pheasant Hollow Ln
- 53 E 600 N
- 60 E 600 N
- 530 Pheasant Hollow Ln Unit 49
Your Personal Tour Guide
Ask me questions while you tour the home.