Estimated Value: $1,461,000 - $1,752,000
4
Beds
3
Baths
2,096
Sq Ft
$787/Sq Ft
Est. Value
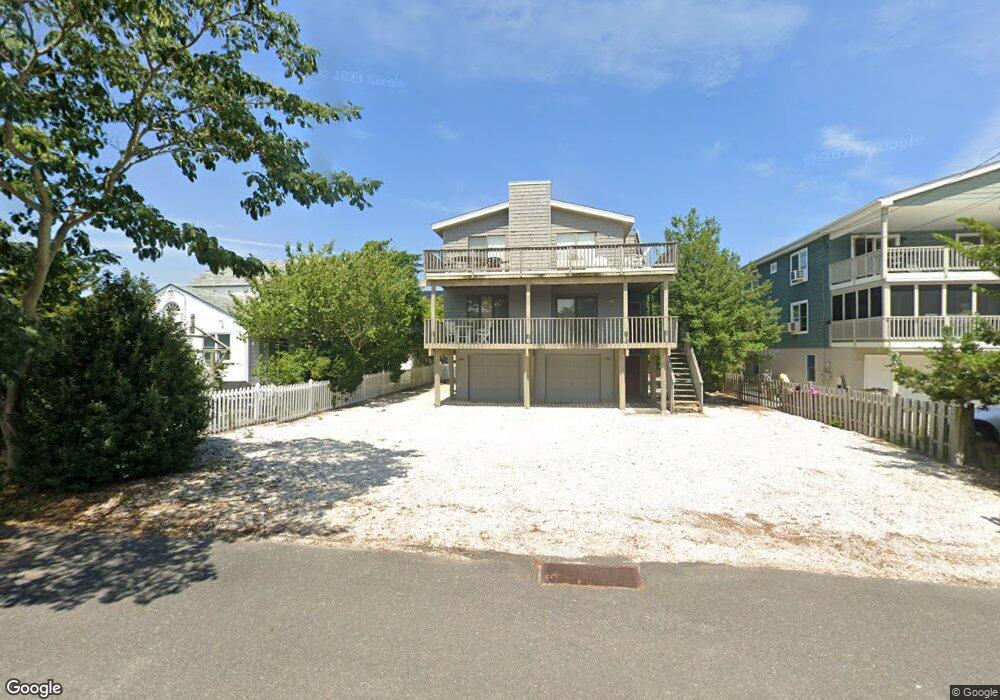
About This Home
This home is located at 2 E 6th St, Barnegat Light, NJ 08006 and is currently estimated at $1,649,152, approximately $786 per square foot. 2 E 6th St is a home located in Ocean County with nearby schools including Ethel A. Jacobsen Elementary School, Long Beach Island Grade School, and Southern Regional Middle School.
Ownership History
Date
Name
Owned For
Owner Type
Purchase Details
Closed on
Feb 22, 2002
Sold by
Gray Linda
Bought by
Williams Christopher and Jensen Melissa
Current Estimated Value
Purchase Details
Closed on
May 7, 1997
Sold by
Mahle David
Bought by
Gray Linda and Gray Hugh Len
Home Financials for this Owner
Home Financials are based on the most recent Mortgage that was taken out on this home.
Original Mortgage
$250,000
Interest Rate
8.12%
Create a Home Valuation Report for This Property
The Home Valuation Report is an in-depth analysis detailing your home's value as well as a comparison with similar homes in the area
Home Values in the Area
Average Home Value in this Area
Purchase History
| Date | Buyer | Sale Price | Title Company |
|---|---|---|---|
| Williams Christopher | $589,000 | -- | |
| Gray Linda | $285,000 | -- |
Source: Public Records
Mortgage History
| Date | Status | Borrower | Loan Amount |
|---|---|---|---|
| Previous Owner | Gray Linda | $250,000 | |
| Closed | Williams Christopher | $0 |
Source: Public Records
Tax History
| Year | Tax Paid | Tax Assessment Tax Assessment Total Assessment is a certain percentage of the fair market value that is determined by local assessors to be the total taxable value of land and additions on the property. | Land | Improvement |
|---|---|---|---|---|
| 2025 | $7,913 | $785,000 | $504,400 | $280,600 |
| 2024 | $6,994 | $785,000 | $504,400 | $280,600 |
Source: Public Records
Map
Nearby Homes
Your Personal Tour Guide
Ask me questions while you tour the home.