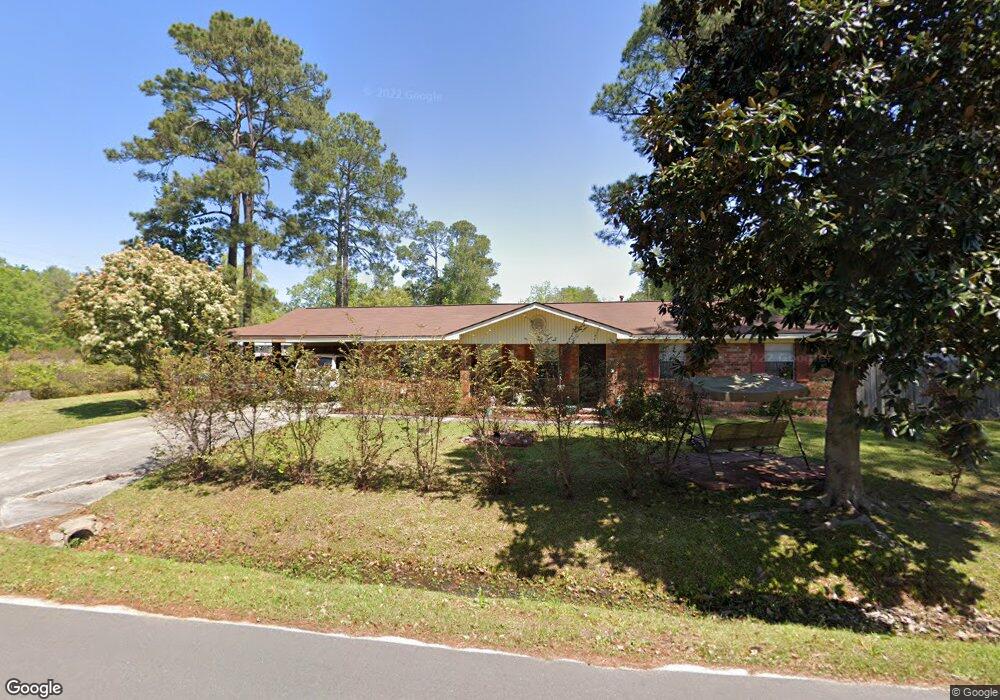
2 E Boulevard St Bloomingdale, GA 31302
Estimated Value: $269,000 - $307,000
3
Beds
2
Baths
1,540
Sq Ft
$185/Sq Ft
Est. Value
About This Home
This home is located at 2 E Boulevard St, Bloomingdale, GA 31302 and is currently estimated at $285,102, approximately $185 per square foot. 2 E Boulevard St is a home located in Chatham County with nearby schools including Bloomingdale Elementary School, West Chatham Middle School, and Groves High School.
Ownership History
Date
Name
Owned For
Owner Type
Purchase Details
Closed on
Feb 13, 2018
Sold by
Gray Joyce A
Bought by
Johnson Harry
Current Estimated Value
Home Financials for this Owner
Home Financials are based on the most recent Mortgage that was taken out on this home.
Original Mortgage
$140,900
Outstanding Balance
$120,448
Interest Rate
4.37%
Mortgage Type
FHA
Estimated Equity
$164,654
Purchase Details
Closed on
May 1, 2015
Sold by
Barlow Spencer T
Bought by
Gray Joyce A
Purchase Details
Closed on
Jul 27, 2012
Sold by
Perry Ruby J
Bought by
Barlow Spencer T and Barlow Kimberly A
Home Financials for this Owner
Home Financials are based on the most recent Mortgage that was taken out on this home.
Original Mortgage
$97,959
Interest Rate
3.68%
Mortgage Type
New Conventional
Purchase Details
Closed on
Oct 16, 2011
Sold by
Devereaux Earl C
Bought by
Perry Ruby J
Create a Home Valuation Report for This Property
The Home Valuation Report is an in-depth analysis detailing your home's value as well as a comparison with similar homes in the area
Home Values in the Area
Average Home Value in this Area
Purchase History
| Date | Buyer | Sale Price | Title Company |
|---|---|---|---|
| Johnson Harry | $143,500 | -- | |
| Gray Joyce A | $93,500 | -- | |
| Barlow Spencer T | $96,000 | -- | |
| Perry Ruby J | -- | -- | |
| Perry Ruby J | -- | -- |
Source: Public Records
Mortgage History
| Date | Status | Borrower | Loan Amount |
|---|---|---|---|
| Open | Johnson Harry | $140,900 | |
| Previous Owner | Barlow Spencer T | $97,959 |
Source: Public Records
Tax History
| Year | Tax Paid | Tax Assessment Tax Assessment Total Assessment is a certain percentage of the fair market value that is determined by local assessors to be the total taxable value of land and additions on the property. | Land | Improvement |
|---|---|---|---|---|
| 2025 | $3,673 | $96,800 | $24,000 | $72,800 |
| 2024 | $9 | $91,160 | $20,000 | $71,160 |
| 2023 | $925 | $79,760 | $15,600 | $64,160 |
| 2022 | $1,366 | $52,440 | $7,800 | $44,640 |
| 2021 | $1,354 | $55,280 | $7,800 | $47,480 |
| 2020 | $1,369 | $54,760 | $7,800 | $46,960 |
| 2019 | $1,369 | $57,400 | $7,749 | $49,651 |
| 2018 | $436 | $50,200 | $7,800 | $42,400 |
| 2017 | $1,191 | $48,360 | $4,840 | $43,520 |
| 2016 | $882 | $37,400 | $3,740 | $33,660 |
| 2015 | $846 | $49,760 | $5,200 | $44,560 |
| 2014 | $1,227 | $50,800 | $0 | $0 |
Source: Public Records
Map
Nearby Homes
- 132 Geranium Way
- 317 Elm St
- 104 Thistle Blossom Way
- 103 Thistle Blossom Way
- 115 Petalridge Way
- 106 Thistle Blossom Way
- 105 Sunbeam Trail
- 110 Thistle Blossom Way
- 12 Walnut St
- 142 Stone Crab Cir
- 138 Stone Crab Cir
- 140 Stone Crab Cir
- 144 Stone Crab Cir
- 148 Stone Crab Cir
- 146 Stone Crab Cir
- 402 Cypress St
- 1724 Pine Barren Rd
- 332 Conaway Rd
- 1333 La Vista Cir
- 1726 Pine Barren Rd
Your Personal Tour Guide
Ask me questions while you tour the home.