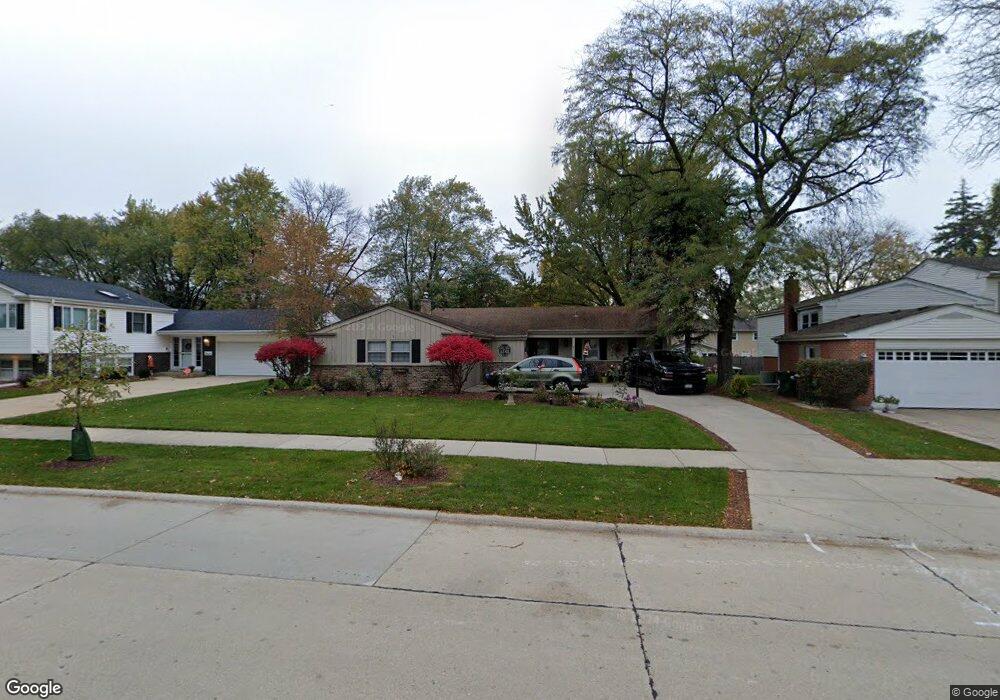
2 E Pickwick Rd Arlington Heights, IL 60005
Surrey Ridge NeighborhoodEstimated Value: $469,000 - $559,000
4
Beds
3
Baths
1,519
Sq Ft
$339/Sq Ft
Est. Value
About This Home
This home is located at 2 E Pickwick Rd, Arlington Heights, IL 60005 and is currently estimated at $515,581, approximately $339 per square foot. 2 E Pickwick Rd is a home located in Cook County with nearby schools including Holmes Jr High School, Juliette Low Elementary School, and Rolling Meadows High School.
Ownership History
Date
Name
Owned For
Owner Type
Purchase Details
Closed on
Oct 14, 2020
Sold by
Harrell Mary Lou and Harrell Gary
Bought by
Harrell Gary and Harrell Mary Lou
Current Estimated Value
Purchase Details
Closed on
Jul 28, 2000
Sold by
Piekos Hilary A and Piekos Judith A
Bought by
Harrell Mary Lou
Home Financials for this Owner
Home Financials are based on the most recent Mortgage that was taken out on this home.
Original Mortgage
$272,900
Outstanding Balance
$99,090
Interest Rate
8.24%
Mortgage Type
Stand Alone First
Estimated Equity
$416,491
Purchase Details
Closed on
Jul 20, 1999
Sold by
Piekos Hilary A and Piekos Judith A
Bought by
Piekos Hilary A and Piekos Judith A
Purchase Details
Closed on
Dec 29, 1993
Sold by
Obyrn Daniel E and Obyrn Josephine T
Bought by
Piekos Hilary A and Piekos Judith A
Home Financials for this Owner
Home Financials are based on the most recent Mortgage that was taken out on this home.
Original Mortgage
$160,000
Interest Rate
7.35%
Create a Home Valuation Report for This Property
The Home Valuation Report is an in-depth analysis detailing your home's value as well as a comparison with similar homes in the area
Home Values in the Area
Average Home Value in this Area
Purchase History
| Date | Buyer | Sale Price | Title Company |
|---|---|---|---|
| Harrell Gary | -- | Attorney | |
| Harrell Mary Lou | $273,000 | -- | |
| Piekos Hilary A | -- | -- | |
| Piekos Hilary A | $221,000 | -- |
Source: Public Records
Mortgage History
| Date | Status | Borrower | Loan Amount |
|---|---|---|---|
| Open | Harrell Mary Lou | $272,900 | |
| Previous Owner | Piekos Hilary A | $160,000 |
Source: Public Records
Tax History Compared to Growth
Tax History
| Year | Tax Paid | Tax Assessment Tax Assessment Total Assessment is a certain percentage of the fair market value that is determined by local assessors to be the total taxable value of land and additions on the property. | Land | Improvement |
|---|---|---|---|---|
| 2024 | $8,280 | $36,578 | $8,750 | $27,828 |
| 2023 | $7,854 | $37,976 | $8,750 | $29,226 |
| 2022 | $7,854 | $37,976 | $8,750 | $29,226 |
| 2021 | $6,067 | $28,129 | $5,687 | $22,442 |
| 2020 | $6,019 | $28,129 | $5,687 | $22,442 |
| 2019 | $7,008 | $31,606 | $5,687 | $25,919 |
| 2018 | $6,014 | $24,939 | $4,812 | $20,127 |
| 2017 | $7,527 | $30,681 | $4,812 | $25,869 |
| 2016 | $7,269 | $30,681 | $4,812 | $25,869 |
| 2015 | $7,407 | $29,327 | $4,375 | $24,952 |
| 2014 | $7,326 | $29,327 | $4,375 | $24,952 |
| 2013 | $7,133 | $29,327 | $4,375 | $24,952 |
Source: Public Records
Map
Nearby Homes
- 1355 S Dunton Ave
- 1535 S Douglas Ave
- 2121 W Haven St
- 1306 S Walnut Ave
- 700 S Noah Terrace
- 1210 S Douglas Ave
- 1607 S Kaspar Ave
- 2234 S Crambourne Way
- 1114 S Fernandez Ave
- 1025 S Fernandez Ave Unit 3M
- 1107 W White Oak St
- 1008 Arbor Ct
- 2206 S Goebbert Rd Unit 409
- 1016 Arbor Ct
- 1020 Arbor Ct
- 808 S Deborah Ln
- 1515 S Harvard Ave
- 116 E Orchard St
- 1720 W Robbie Ln
- 1415 E Central Rd Unit 219C
- 6 W Pickwick Rd
- 4 W Pickwick Rd
- 5 E Emerson St
- 8 W Pickwick Rd
- 3 E Emerson St
- 9 E Emerson St
- 10 E Pickwick Rd
- 3 W Emerson St
- 1525 S Surrey Ridge Dr
- 17 E Emerson St
- 7 E Emerson St
- 12 W Pickwick Rd
- 7 E Pickwick Rd
- 1526 S Surrey Ridge Dr
- 11 W Emerson St
- 1529 S Surrey Ridge Dr
- 16 W Pickwick Rd
- 4 W Emerson St
- 1530 S Surrey Ridge Dr
- 15 W Emerson St