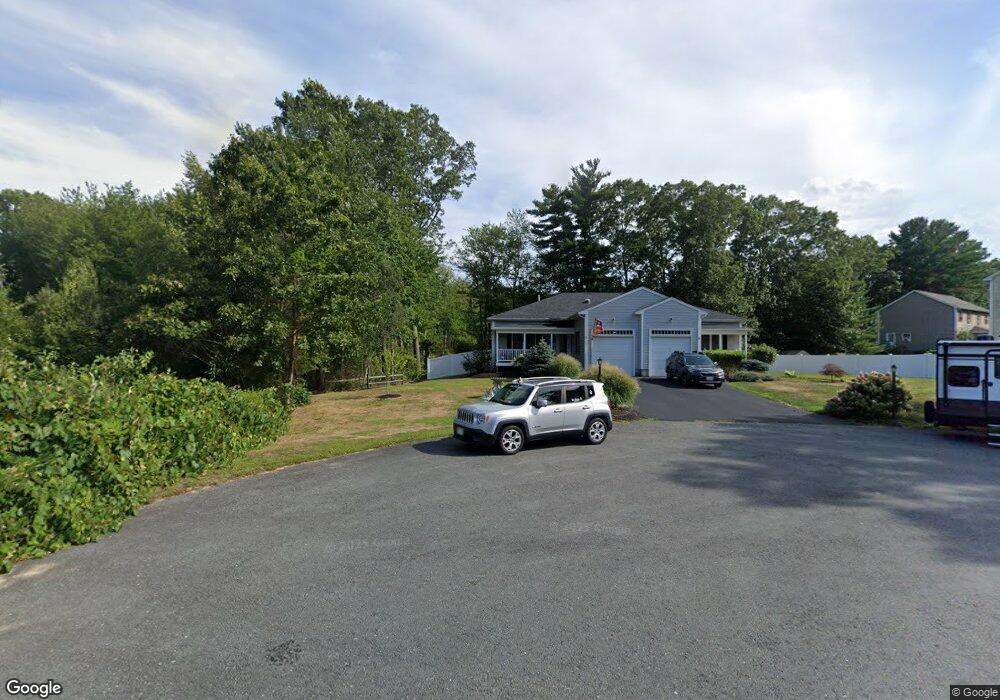
2 Eagles Cir Unit 2 Berkley, MA 02779
Estimated Value: $426,000 - $505,000
2
Beds
2
Baths
1,380
Sq Ft
$339/Sq Ft
Est. Value
About This Home
This home is located at 2 Eagles Cir Unit 2, Berkley, MA 02779 and is currently estimated at $467,719, approximately $338 per square foot. 2 Eagles Cir Unit 2 is a home located in Bristol County with nearby schools including Berkley Community School and Our Lady of Lourdes School.
Ownership History
Date
Name
Owned For
Owner Type
Purchase Details
Closed on
Sep 9, 2024
Sold by
Dechellis John and Dechellis Shara
Bought by
Teles Tania M and Teles Amanda F
Current Estimated Value
Home Financials for this Owner
Home Financials are based on the most recent Mortgage that was taken out on this home.
Original Mortgage
$408,500
Outstanding Balance
$403,421
Interest Rate
6.78%
Mortgage Type
Purchase Money Mortgage
Estimated Equity
$64,298
Purchase Details
Closed on
Jul 20, 2009
Sold by
Berkley Riv Bend Est L
Bought by
Dechellis John and Dechellis Shara
Home Financials for this Owner
Home Financials are based on the most recent Mortgage that was taken out on this home.
Original Mortgage
$214,712
Interest Rate
5.31%
Mortgage Type
Purchase Money Mortgage
Purchase Details
Closed on
Aug 19, 2004
Sold by
Saraceno Ft and Saraceno
Bought by
Saraceno Dev Llc
Create a Home Valuation Report for This Property
The Home Valuation Report is an in-depth analysis detailing your home's value as well as a comparison with similar homes in the area
Purchase History
| Date | Buyer | Sale Price | Title Company |
|---|---|---|---|
| Teles Tania M | $430,000 | None Available | |
| Teles Tania M | $430,000 | None Available | |
| Dechellis John | $223,325 | -- | |
| Dechellis John | $223,325 | -- | |
| Saraceno Dev Llc | -- | -- | |
| Saraceno Dev Llc | -- | -- |
Source: Public Records
Mortgage History
| Date | Status | Borrower | Loan Amount |
|---|---|---|---|
| Open | Teles Tania M | $408,500 | |
| Closed | Teles Tania M | $408,500 | |
| Previous Owner | Dechellis John | $214,712 |
Source: Public Records
Tax History
| Year | Tax Paid | Tax Assessment Tax Assessment Total Assessment is a certain percentage of the fair market value that is determined by local assessors to be the total taxable value of land and additions on the property. | Land | Improvement |
|---|---|---|---|---|
| 2025 | $55 | $455,200 | $0 | $455,200 |
| 2024 | $5,392 | $433,100 | $0 | $433,100 |
| 2023 | $4,947 | $374,200 | $0 | $374,200 |
| 2022 | $4,901 | $356,400 | $0 | $356,400 |
| 2021 | $4,051 | $283,700 | $0 | $283,700 |
| 2020 | $3,747 | $257,900 | $0 | $257,900 |
| 2019 | $3,355 | $229,200 | $0 | $229,200 |
| 2018 | $3,213 | $229,200 | $0 | $229,200 |
| 2017 | $3,278 | $229,200 | $0 | $229,200 |
| 2016 | $3,401 | $229,200 | $0 | $229,200 |
| 2015 | $2,953 | $212,300 | $0 | $212,300 |
| 2014 | $3,678 | $287,100 | $0 | $287,100 |
Source: Public Records
Map
Nearby Homes
- 75 Sanford St
- 2 Bc Ln
- 2 Lima Ln
- LOT 2A Hudson Dr Unit 2A
- 4 Lawton St Unit A
- 852 Somerset Ave
- 90 E Water St
- 6 Marvel St
- 50 Highland St Unit 74
- 263 Summer St
- 6 Southeast St
- 450 Somerset Ave Unit 3-7
- 66 S Main St
- 23 Plain St
- 9 Akron Ln
- 810 Tremont St
- 4 Staples Ave
- 21 Briggs St
- 24 1st St
- 52 General Cobb St
- 2 Eagles Cir
- 4 Eagles Cir Unit 4
- 4 Eagles Cir
- 11 Admirals Way
- 11 Admirals Way Unit 11
- 9 Admirals Way Unit 9
- 9 Admirals Way
- 7 Admirals Way
- 7 Admirals Way Unit 7
- 5 Admirals Way
- 5 Admirals Way Unit 5
- 17 Admirals Way
- 15 Admirals Way
- 13 Admirals Way
- 15 Admirals Way Unit 15
- 1 Admirals Way
- 3 Admirals Way
- 8 Admirals Way
- 6 Admirals Way
- 4 Admirals Way
Your Personal Tour Guide
Ask me questions while you tour the home.