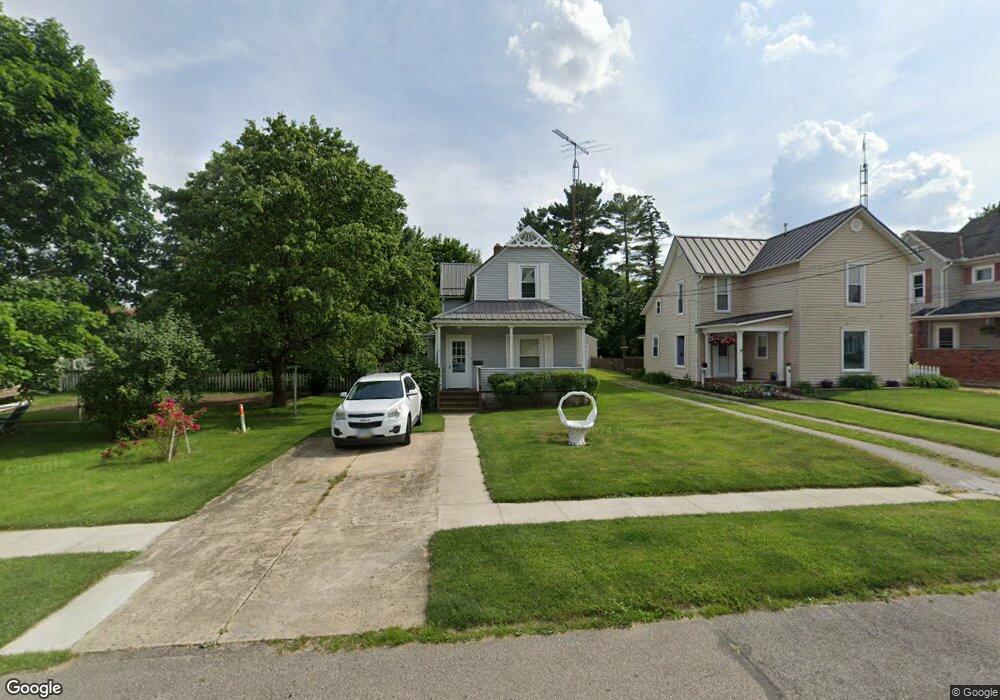
2 Earl Ave Shelby, OH 44875
Estimated Value: $117,533 - $141,000
2
Beds
1
Bath
1,377
Sq Ft
$92/Sq Ft
Est. Value
About This Home
This home is located at 2 Earl Ave, Shelby, OH 44875 and is currently estimated at $127,133, approximately $92 per square foot. 2 Earl Ave is a home located in Richland County with nearby schools including St. Mary's School.
Ownership History
Date
Name
Owned For
Owner Type
Purchase Details
Closed on
Dec 10, 1998
Sold by
Patton Paul E
Bought by
Eichelberger Ella
Current Estimated Value
Home Financials for this Owner
Home Financials are based on the most recent Mortgage that was taken out on this home.
Original Mortgage
$74,200
Outstanding Balance
$17,073
Interest Rate
6.93%
Mortgage Type
New Conventional
Estimated Equity
$110,060
Purchase Details
Closed on
Jul 10, 1998
Sold by
Hackett Mary B
Bought by
Patton Paul E
Home Financials for this Owner
Home Financials are based on the most recent Mortgage that was taken out on this home.
Original Mortgage
$30,000
Interest Rate
10.25%
Mortgage Type
New Conventional
Create a Home Valuation Report for This Property
The Home Valuation Report is an in-depth analysis detailing your home's value as well as a comparison with similar homes in the area
Home Values in the Area
Average Home Value in this Area
Purchase History
| Date | Buyer | Sale Price | Title Company |
|---|---|---|---|
| Eichelberger Ella | $59,000 | -- | |
| Patton Paul E | $34,800 | -- |
Source: Public Records
Mortgage History
| Date | Status | Borrower | Loan Amount |
|---|---|---|---|
| Open | Eichelberger Ella | $74,200 | |
| Previous Owner | Patton Paul E | $30,000 |
Source: Public Records
Tax History Compared to Growth
Tax History
| Year | Tax Paid | Tax Assessment Tax Assessment Total Assessment is a certain percentage of the fair market value that is determined by local assessors to be the total taxable value of land and additions on the property. | Land | Improvement |
|---|---|---|---|---|
| 2024 | $673 | $27,410 | $4,190 | $23,220 |
| 2023 | $673 | $27,410 | $4,190 | $23,220 |
| 2022 | $606 | $22,940 | $4,010 | $18,930 |
| 2021 | $606 | $22,940 | $4,010 | $18,930 |
| 2020 | $607 | $22,940 | $4,010 | $18,930 |
| 2019 | $500 | $19,470 | $3,400 | $16,070 |
| 2018 | $495 | $19,470 | $3,400 | $16,070 |
| 2017 | $890 | $19,470 | $3,400 | $16,070 |
| 2016 | $948 | $20,860 | $3,230 | $17,630 |
| 2015 | $942 | $20,860 | $3,230 | $17,630 |
| 2014 | $911 | $20,860 | $3,230 | $17,630 |
| 2012 | $448 | $20,860 | $3,400 | $17,460 |
Source: Public Records
Map
Nearby Homes