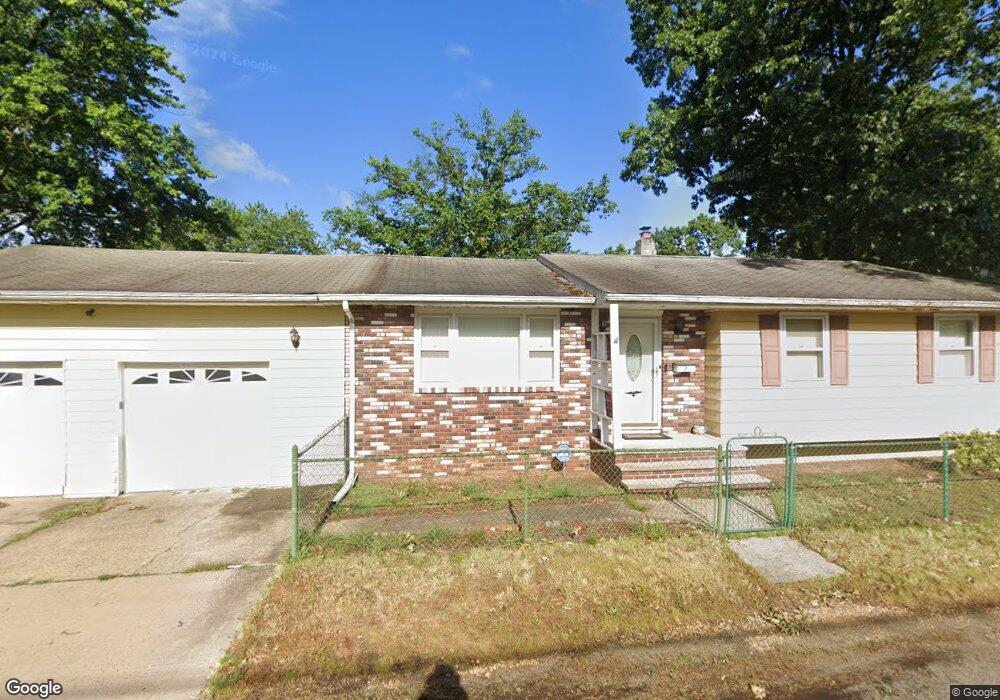
2 Edgar St Old Bridge, NJ 08857
Estimated Value: $477,025 - $590,000
--
Bed
--
Bath
1,188
Sq Ft
$435/Sq Ft
Est. Value
About This Home
This home is located at 2 Edgar St, Old Bridge, NJ 08857 and is currently estimated at $517,256, approximately $435 per square foot. 2 Edgar St is a home located in Middlesex County with nearby schools including Old Bridge High School and St. Thomas the Apostle School.
Ownership History
Date
Name
Owned For
Owner Type
Purchase Details
Closed on
Mar 23, 2017
Sold by
Curran George P and Curran Olga I
Bought by
Curran George P
Current Estimated Value
Home Financials for this Owner
Home Financials are based on the most recent Mortgage that was taken out on this home.
Original Mortgage
$224,867
Outstanding Balance
$186,472
Interest Rate
4.17%
Mortgage Type
FHA
Estimated Equity
$330,784
Purchase Details
Closed on
Dec 22, 1998
Sold by
Vaganek Michael
Bought by
Curran George and Curran Olga
Home Financials for this Owner
Home Financials are based on the most recent Mortgage that was taken out on this home.
Original Mortgage
$112,500
Interest Rate
6.7%
Create a Home Valuation Report for This Property
The Home Valuation Report is an in-depth analysis detailing your home's value as well as a comparison with similar homes in the area
Home Values in the Area
Average Home Value in this Area
Purchase History
| Date | Buyer | Sale Price | Title Company |
|---|---|---|---|
| Curran George P | $104,000 | Lenders Title Solutions Llc | |
| Curran George | $125,000 | -- |
Source: Public Records
Mortgage History
| Date | Status | Borrower | Loan Amount |
|---|---|---|---|
| Open | Curran George P | $224,867 | |
| Closed | Curran George | $112,500 |
Source: Public Records
Tax History Compared to Growth
Tax History
| Year | Tax Paid | Tax Assessment Tax Assessment Total Assessment is a certain percentage of the fair market value that is determined by local assessors to be the total taxable value of land and additions on the property. | Land | Improvement |
|---|---|---|---|---|
| 2025 | $7,527 | $133,300 | $42,800 | $90,500 |
| 2024 | $7,221 | $133,300 | $42,800 | $90,500 |
| 2023 | $7,221 | $133,300 | $42,800 | $90,500 |
| 2022 | $7,056 | $133,300 | $42,800 | $90,500 |
| 2021 | $5,178 | $133,300 | $42,800 | $90,500 |
| 2020 | $6,848 | $133,300 | $42,800 | $90,500 |
| 2019 | $6,732 | $133,300 | $42,800 | $90,500 |
| 2018 | $6,657 | $133,300 | $42,800 | $90,500 |
| 2017 | $6,441 | $133,300 | $42,800 | $90,500 |
| 2016 | $6,308 | $133,300 | $42,800 | $90,500 |
| 2015 | $6,198 | $133,300 | $42,800 | $90,500 |
| 2014 | $6,136 | $133,300 | $42,800 | $90,500 |
Source: Public Records
Map
Nearby Homes