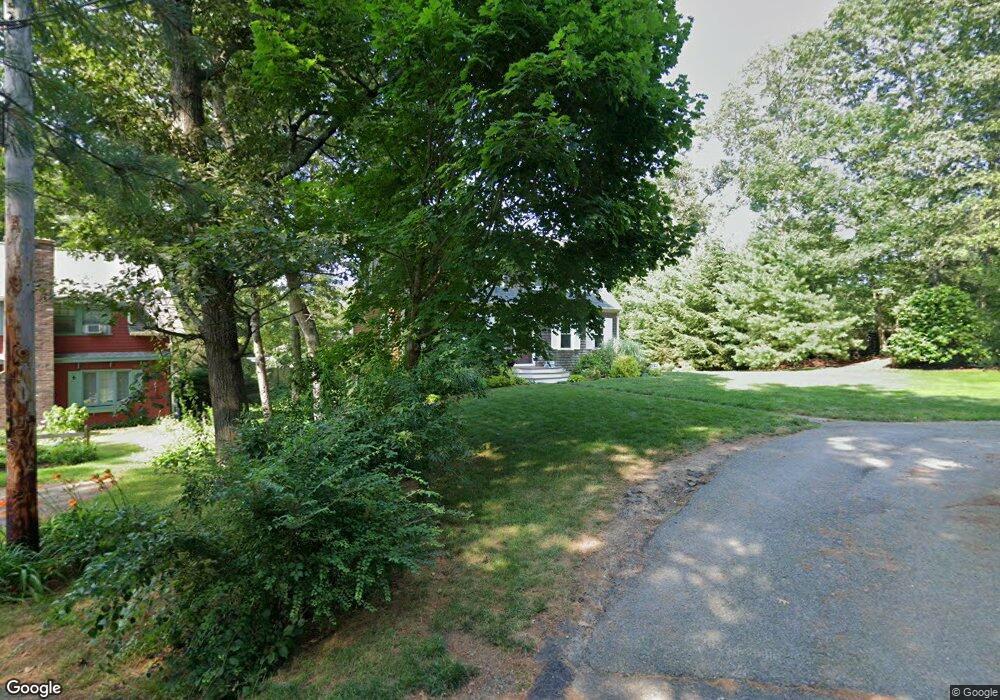
2 Evergreen Hill Rd Bourne, MA 2532
Monument Beach NeighborhoodEstimated Value: $729,000 - $855,000
3
Beds
2
Baths
1,501
Sq Ft
$542/Sq Ft
Est. Value
About This Home
This home is located at 2 Evergreen Hill Rd, Bourne, MA 2532 and is currently estimated at $812,827, approximately $541 per square foot. 2 Evergreen Hill Rd is a home located in Barnstable County with nearby schools including Bourne High School, St Margaret Regional School, and Cadence Academy Preschool - Bourne.
Ownership History
Date
Name
Owned For
Owner Type
Purchase Details
Closed on
Dec 7, 1999
Sold by
Gauley Melvin
Bought by
Maurice Daniel G and Maurice Monice
Current Estimated Value
Purchase Details
Closed on
Jun 30, 1998
Sold by
Pires Anthony T and Pires Bemvinda M
Bought by
Gauley Melvin
Create a Home Valuation Report for This Property
The Home Valuation Report is an in-depth analysis detailing your home's value as well as a comparison with similar homes in the area
Home Values in the Area
Average Home Value in this Area
Purchase History
| Date | Buyer | Sale Price | Title Company |
|---|---|---|---|
| Maurice Daniel G | $177,150 | -- | |
| Maurice Daniel G | $177,150 | -- | |
| Gauley Melvin | $46,900 | -- | |
| Gauley Melvin | $46,900 | -- |
Source: Public Records
Mortgage History
| Date | Status | Borrower | Loan Amount |
|---|---|---|---|
| Open | Gauley Melvin | $150,300 | |
| Closed | Gauley Melvin | $151,200 |
Source: Public Records
Tax History
| Year | Tax Paid | Tax Assessment Tax Assessment Total Assessment is a certain percentage of the fair market value that is determined by local assessors to be the total taxable value of land and additions on the property. | Land | Improvement |
|---|---|---|---|---|
| 2025 | $6,212 | $795,400 | $216,900 | $578,500 |
| 2024 | $6,121 | $763,200 | $206,600 | $556,600 |
| 2023 | $5,995 | $680,500 | $182,800 | $497,700 |
| 2022 | $5,621 | $557,100 | $161,800 | $395,300 |
| 2021 | $5,505 | $511,100 | $147,300 | $363,800 |
| 2020 | $4,759 | $443,100 | $145,900 | $297,200 |
| 2019 | $3,708 | $352,800 | $133,200 | $219,600 |
| 2018 | $3,208 | $304,400 | $126,900 | $177,500 |
| 2017 | $3,104 | $301,400 | $125,700 | $175,700 |
| 2016 | $3,019 | $297,100 | $125,700 | $171,400 |
| 2015 | $2,992 | $297,100 | $125,700 | $171,400 |
Source: Public Records
Map
Nearby Homes
- 203 County Rd
- 566 Shore Rd
- 35 Benedict Rd
- 13 Laurel Hill Ct
- 16 Amberwood Ct
- 12 Turnberry Rd Unit 12
- 5 Zoli Ln
- 5 Sea Knoll Ct
- 4 Harbor Hill Dr
- 4 Hollyhock Knoll Ct Unit 4
- 4 Hollyhock Knoll Ct Unit 4
- 20 Colony Ave
- 60 Bourne Neck Dr
- 44 Cotuit Rd
- 14 Navajo Rd
- 46 Holt Rd Unit B
- 46 Holt Rd
- 60 Sandwich Rd
- 10 Sandy Ln
- 709 County Rd
Your Personal Tour Guide
Ask me questions while you tour the home.