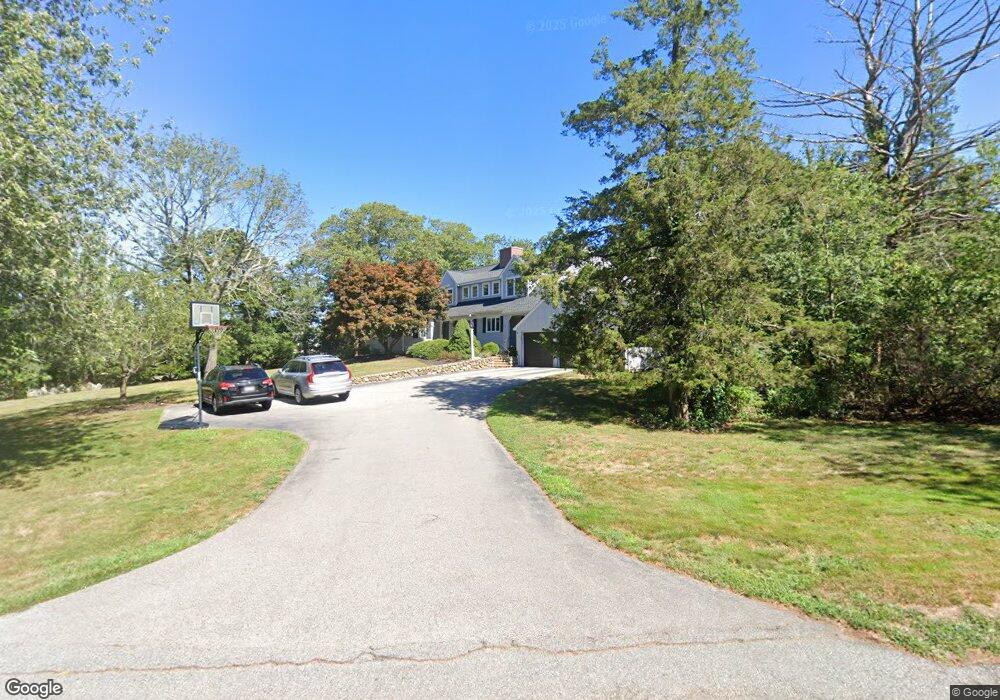
2 Evergreen Ln Hingham, MA 02043
Estimated Value: $1,749,000 - $1,981,000
3
Beds
4
Baths
3,127
Sq Ft
$593/Sq Ft
Est. Value
About This Home
This home is located at 2 Evergreen Ln, Hingham, MA 02043 and is currently estimated at $1,854,759, approximately $593 per square foot. 2 Evergreen Ln is a home located in Plymouth County with nearby schools including East Elementary School, Hingham Middle School, and Hingham High School.
Ownership History
Date
Name
Owned For
Owner Type
Purchase Details
Closed on
May 31, 2012
Sold by
Anastos Eleanor A Est
Bought by
Kelly John E and Kelly Heather M
Current Estimated Value
Home Financials for this Owner
Home Financials are based on the most recent Mortgage that was taken out on this home.
Original Mortgage
$61,600
Outstanding Balance
$42,680
Interest Rate
3.9%
Mortgage Type
New Conventional
Estimated Equity
$1,812,079
Create a Home Valuation Report for This Property
The Home Valuation Report is an in-depth analysis detailing your home's value as well as a comparison with similar homes in the area
Purchase History
| Date | Buyer | Sale Price | Title Company |
|---|---|---|---|
| Kelly John E | $770,000 | -- |
Source: Public Records
Mortgage History
| Date | Status | Borrower | Loan Amount |
|---|---|---|---|
| Open | Kelly John E | $61,600 |
Source: Public Records
Tax History
| Year | Tax Paid | Tax Assessment Tax Assessment Total Assessment is a certain percentage of the fair market value that is determined by local assessors to be the total taxable value of land and additions on the property. | Land | Improvement |
|---|---|---|---|---|
| 2025 | $16,274 | $1,522,400 | $656,800 | $865,600 |
| 2024 | $15,799 | $1,456,100 | $656,800 | $799,300 |
| 2023 | $13,488 | $1,348,800 | $656,800 | $692,000 |
| 2022 | $13,921 | $1,204,200 | $588,700 | $615,500 |
| 2021 | $0 | $1,098,500 | $566,000 | $532,500 |
| 2020 | $0 | $1,098,500 | $566,000 | $532,500 |
| 2019 | $12,428 | $1,052,300 | $566,000 | $486,300 |
| 2018 | $0 | $1,043,000 | $566,000 | $477,000 |
| 2017 | $12,532 | $1,023,000 | $584,500 | $438,500 |
| 2016 | $12,433 | $995,400 | $556,900 | $438,500 |
| 2015 | $10,128 | $808,300 | $530,400 | $277,900 |
Source: Public Records
Map
Nearby Homes
Your Personal Tour Guide
Ask me questions while you tour the home.