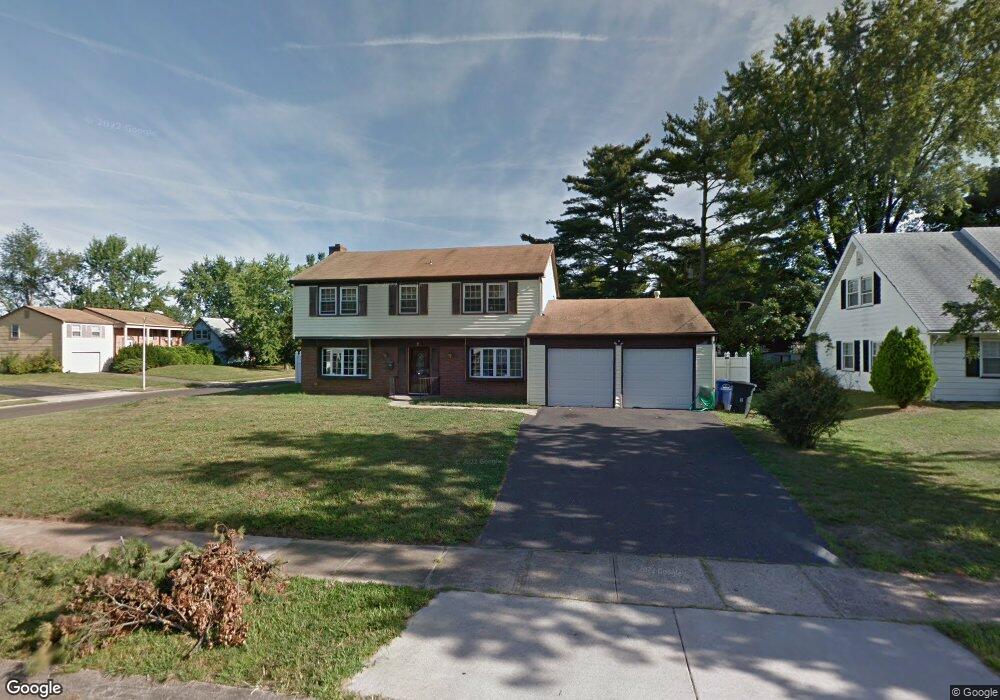
2 Excell Ln Willingboro, NJ 08046
Estimated Value: $384,834 - $441,000
--
Bed
--
Bath
2,400
Sq Ft
$172/Sq Ft
Est. Value
About This Home
This home is located at 2 Excell Ln, Willingboro, NJ 08046 and is currently estimated at $412,209, approximately $171 per square foot. 2 Excell Ln is a home located in Burlington County with nearby schools including Twin Hills Elementary School, Memorial Middle School, and Levitt Intermediate School.
Ownership History
Date
Name
Owned For
Owner Type
Purchase Details
Closed on
Jun 13, 2017
Sold by
Hamilton Sondra V
Bought by
Abc Bail Bonds Inc
Current Estimated Value
Home Financials for this Owner
Home Financials are based on the most recent Mortgage that was taken out on this home.
Interest Rate
3.89%
Purchase Details
Closed on
Oct 5, 2003
Sold by
Hamilton David S and Hamilton Sondra V
Bought by
Hamilton Sondra
Create a Home Valuation Report for This Property
The Home Valuation Report is an in-depth analysis detailing your home's value as well as a comparison with similar homes in the area
Home Values in the Area
Average Home Value in this Area
Purchase History
| Date | Buyer | Sale Price | Title Company |
|---|---|---|---|
| Abc Bail Bonds Inc | -- | -- | |
| Hamilton Sondra | -- | -- |
Source: Public Records
Mortgage History
| Date | Status | Borrower | Loan Amount |
|---|---|---|---|
| Closed | Abc Bail Bonds Inc | -- | |
| Previous Owner | Abc Bail Bonds Inc | $66,634 | |
| Previous Owner | Abc Bail Bonds Inc | $65,679 | |
| Previous Owner | Abc Bail Bonds Inc | $65,679 |
Source: Public Records
Tax History Compared to Growth
Tax History
| Year | Tax Paid | Tax Assessment Tax Assessment Total Assessment is a certain percentage of the fair market value that is determined by local assessors to be the total taxable value of land and additions on the property. | Land | Improvement |
|---|---|---|---|---|
| 2025 | $10,296 | $238,500 | $44,100 | $194,400 |
| 2024 | $10,220 | $238,500 | $44,100 | $194,400 |
| 2023 | $10,220 | $238,500 | $44,100 | $194,400 |
| 2022 | $9,514 | $238,500 | $44,100 | $194,400 |
| 2021 | $9,530 | $238,500 | $44,100 | $194,400 |
| 2020 | $9,571 | $238,500 | $44,100 | $194,400 |
| 2019 | $9,480 | $238,500 | $44,100 | $194,400 |
| 2018 | $9,304 | $238,500 | $44,100 | $194,400 |
| 2017 | $9,044 | $238,500 | $44,100 | $194,400 |
| 2016 | $8,953 | $238,500 | $44,100 | $194,400 |
| 2015 | $8,646 | $238,500 | $44,100 | $194,400 |
| 2014 | $8,231 | $238,500 | $44,100 | $194,400 |
Source: Public Records
Map
Nearby Homes
- 10 Elderberry Ln
- 2 Evergreen Ct
- 104 Evergreen Dr
- 80 Ember Ln
- 19 Eddington Ln
- 126 Olive St
- 24 Elliot Ln
- 69 Alexander Way
- 120 Second St
- 11 Guild Ct
- 7 Nelsons Way
- 59 Elliot Ln
- 67 Alexander Way
- 65 Alexander Way
- 71 Alexander Way
- 73 Alexander Way
- 75 Alexander Way
- 18 Edgewater Ln
- 16 Edgely Place
- 11 Valley Farm Rd