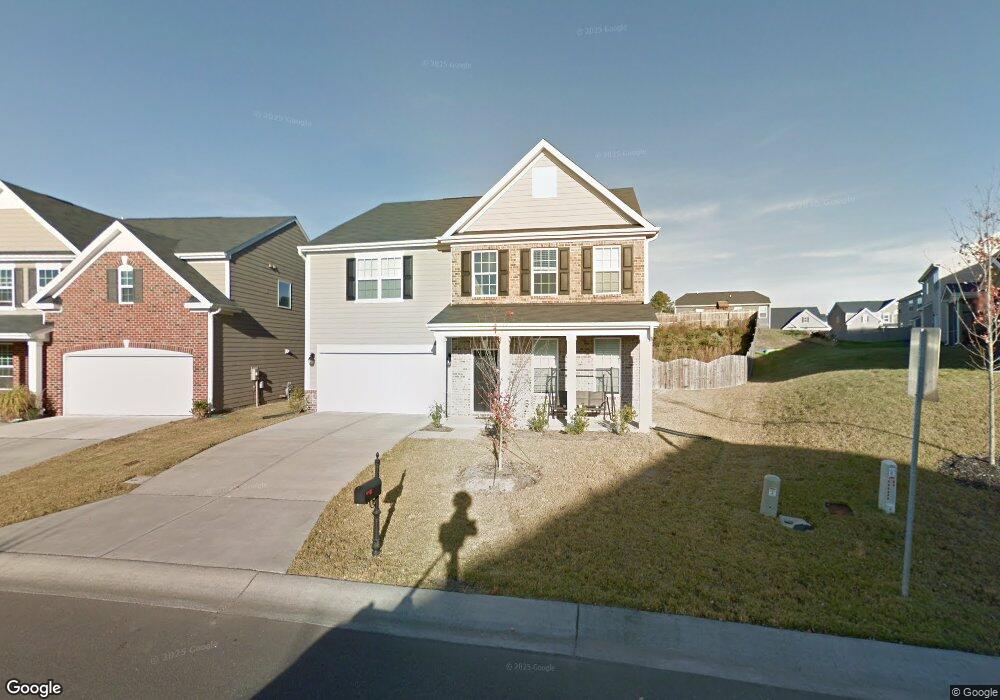
2 Faircroft Ct Durham, NC 27703
Eastern Durham NeighborhoodEstimated Value: $455,000 - $544,000
5
Beds
3
Baths
3,483
Sq Ft
$145/Sq Ft
Est. Value
About This Home
This home is located at 2 Faircroft Ct, Durham, NC 27703 and is currently estimated at $506,668, approximately $145 per square foot. 2 Faircroft Ct is a home located in Durham County with nearby schools including Spring Valley Elementary School, John W Neal Middle School, and Southern School of Energy & Sustainability.
Ownership History
Date
Name
Owned For
Owner Type
Purchase Details
Closed on
Jan 15, 2021
Sold by
Equity Trust Company
Bought by
Tsang Yu Feng and Tsang Hongyan
Current Estimated Value
Home Financials for this Owner
Home Financials are based on the most recent Mortgage that was taken out on this home.
Original Mortgage
$266,250
Outstanding Balance
$237,629
Interest Rate
2.71%
Mortgage Type
New Conventional
Estimated Equity
$269,039
Purchase Details
Closed on
Oct 15, 2018
Sold by
Alqahtani Bandar and Alqahtani Mona
Bought by
Equity Trust Co and Hui Wang Ira
Home Financials for this Owner
Home Financials are based on the most recent Mortgage that was taken out on this home.
Original Mortgage
$200,000
Interest Rate
4.5%
Mortgage Type
Commercial
Purchase Details
Closed on
Jan 31, 2013
Sold by
Hearthstone Multi Aset Entity B Lp
Bought by
Alqahtani Bandar
Create a Home Valuation Report for This Property
The Home Valuation Report is an in-depth analysis detailing your home's value as well as a comparison with similar homes in the area
Home Values in the Area
Average Home Value in this Area
Purchase History
| Date | Buyer | Sale Price | Title Company |
|---|---|---|---|
| Tsang Yu Feng | $355,000 | None Available | |
| Equity Trust Co | $310,000 | None Available | |
| Alqahtani Bandar | $232,000 | None Available |
Source: Public Records
Mortgage History
| Date | Status | Borrower | Loan Amount |
|---|---|---|---|
| Open | Tsang Yu Feng | $266,250 | |
| Previous Owner | Equity Trust Co | $200,000 |
Source: Public Records
Tax History
| Year | Tax Paid | Tax Assessment Tax Assessment Total Assessment is a certain percentage of the fair market value that is determined by local assessors to be the total taxable value of land and additions on the property. | Land | Improvement |
|---|---|---|---|---|
| 2025 | $5,023 | $506,674 | $101,150 | $405,524 |
| 2024 | $4,408 | $316,001 | $44,437 | $271,564 |
| 2023 | $4,139 | $316,001 | $44,437 | $271,564 |
| 2022 | $4,045 | $316,001 | $44,437 | $271,564 |
| 2021 | $4,026 | $316,001 | $44,437 | $271,564 |
| 2020 | $3,931 | $316,001 | $44,437 | $271,564 |
| 2019 | $3,931 | $316,001 | $44,437 | $271,564 |
| 2018 | $3,746 | $276,132 | $47,400 | $228,732 |
| 2017 | $3,718 | $276,132 | $47,400 | $228,732 |
| 2016 | $3,593 | $276,132 | $47,400 | $228,732 |
| 2015 | $4,032 | $291,234 | $48,888 | $242,346 |
| 2014 | $4,032 | $291,234 | $48,888 | $242,346 |
Source: Public Records
Map
Nearby Homes
- 111 Glenview Ln
- 1107 High Fox Dr
- 148 Daneborg Rd
- 3311 Delmar Dr
- 1015 Sora Way
- 500 Kings Lake Way
- 907 Danbury Dr
- 106 Token House Rd
- 142 Token House Rd
- 2055 Tanners Mill Dr
- 1315 Pennock Rd
- 3315 Delmar Dr
- 3311 Gypsum Dr
- 3301 Gypsum Dr
- 3313 Delmar Dr
- 3309 Delmar Dr
- 3307 Delmar Dr
- 1030 Thoughtful Spot Ln
- 1005 Gemstone Way
- 3908 Holder Rd
- 4 Faircroft Ct
- 201 Glenview Ln
- 203 Glenview Ln
- 6 Faircroft Ct
- 123 Glenview Ln
- 205 Glenview Ln
- 1202 Willowcrest Rd
- 8 Faircroft Ct
- 5 Faircroft Ct
- 1204 Willowcrest Rd
- 121 Glenview Ln
- 207 Glenview Ln
- 119 Glenview Ln
- 128 Glenview Ln
- 200 Glenview Ln
- 111 Peninsula Ct
- 202 Glenview Ln
- 126 Glenview Ln
- 113 Peninsula Ct
- 209 Glenview Ln
Your Personal Tour Guide
Ask me questions while you tour the home.