2 Falkirk Ln Rolling Meadows, IL 60008
Plum Grove Village NeighborhoodEstimated Value: $393,148 - $481,000
About This Home
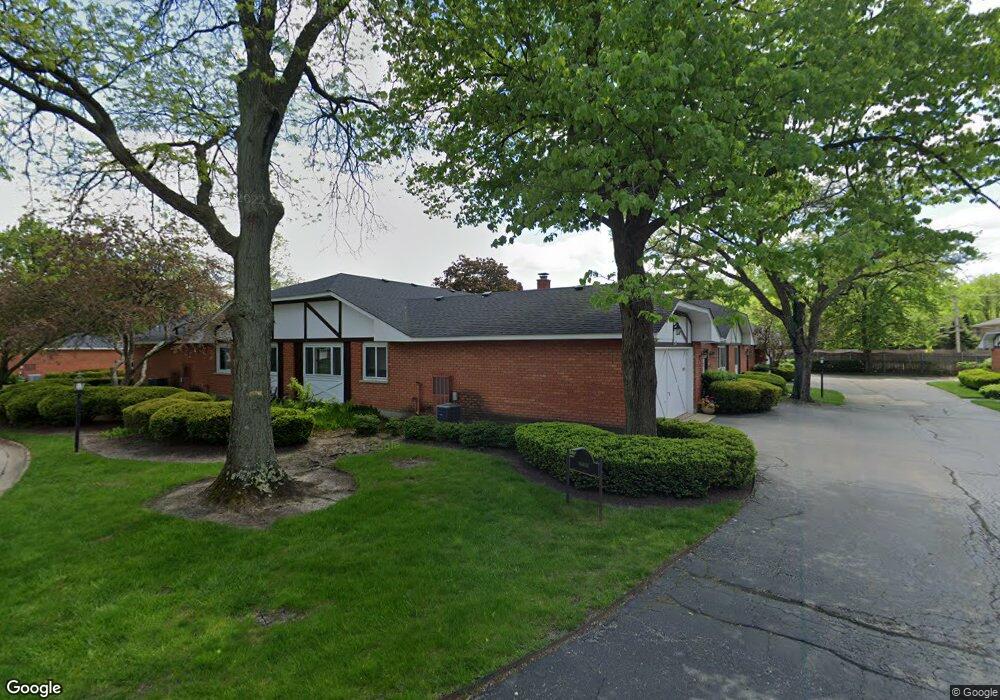
This home is located at 2 Falkirk Ln, Rolling Meadows, IL 60008 and is currently estimated at $420,287, approximately $260 per square foot. 2 Falkirk Ln is a home located in Cook County with nearby schools including Central Road Elementary School, Plum Grove Jr High School, and William Fremd High School.
Ownership History
We collect this data history from publicly available records. To have your information removed, we recommend requesting removal directly through your county’s website.
Purchase Details
Purchase Details
Home Financials for this Owner
Home Financials are based on the most recent Mortgage that was taken out on this home.Purchase Details
Home Financials for this Owner
Home Financials are based on the most recent Mortgage that was taken out on this home.Purchase Details
Home Values in the Area
Average Home Value in this Area
Purchase History
We collect this data history from publicly available records. To have your information removed, we recommend requesting removal directly through your county’s website.
| Date | Buyer | Sale Price | Title Company |
|---|---|---|---|
| -- | None Available | ||
| $287,000 | Git | ||
| $115,333 | -- | ||
| $150,000 | -- |
Mortgage History
We collect this data history from publicly available records. To have your information removed, we recommend requesting removal directly through your county’s website.
| Date | Status | Borrower | Loan Amount |
|---|---|---|---|
| Open | $187,000 | ||
| Previous Owner | $138,300 |
Tax History
We collect this data history from publicly available records. To have your information removed, we recommend requesting removal directly through your county’s website.
| Year | Tax Paid | Tax Assessment Tax Assessment Total Assessment is a certain percentage of the fair market value that is determined by local assessors to be the total taxable value of land and additions on the property. | Land | Improvement |
|---|---|---|---|---|
| 2025 | $7,398 | $31,000 | $5,486 | $25,514 |
| 2024 | $7,398 | $26,750 | $5,999 | $20,751 |
| 2023 | $7,091 | $26,750 | $5,999 | $20,751 |
| 2022 | $7,091 | $26,750 | $5,999 | $20,751 |
| 2021 | $6,006 | $20,898 | $3,703 | $17,195 |
| 2020 | $5,987 | $20,898 | $3,703 | $17,195 |
| 2019 | $5,977 | $23,195 | $3,703 | $19,492 |
| 2018 | $5,216 | $19,014 | $3,291 | $15,723 |
| 2017 | $5,129 | $19,014 | $3,291 | $15,723 |
| 2016 | $5,079 | $19,135 | $3,291 | $15,844 |
| 2015 | $5,462 | $19,364 | $3,017 | $16,347 |
| 2014 | $5,362 | $19,364 | $3,017 | $16,347 |
| 2013 | $5,211 | $19,364 | $3,017 | $16,347 |
Map
- 4277 Wilson Ave
- 4530 Fairfax Ave
- 1507 S Garden St
- 1 Carlisle on Duxbury
- 4331 Hoover St
- 4406 Euclid Ave Unit 2C
- 2600 Brookwood Way Dr Unit 114
- 2600 Brookwood Way Dr Unit 206
- 4710 Euclid Ave Unit 1C
- 3000 California Ave
- 2401 Rohlwing Rd
- 2302 Lisa Ct
- 2 Dogwood Rd
- 3946 Balmoral Ct Unit 6
- 876 S Plum Grove Rd Unit 208
- 3107 Falcon Ct W
- 36 W Fern Ct Unit 117B
- 4795 Woodcliff Ln
- 731 S Michigan Ct
- 2814 Cardinal Dr
Ask me questions while you tour the home.