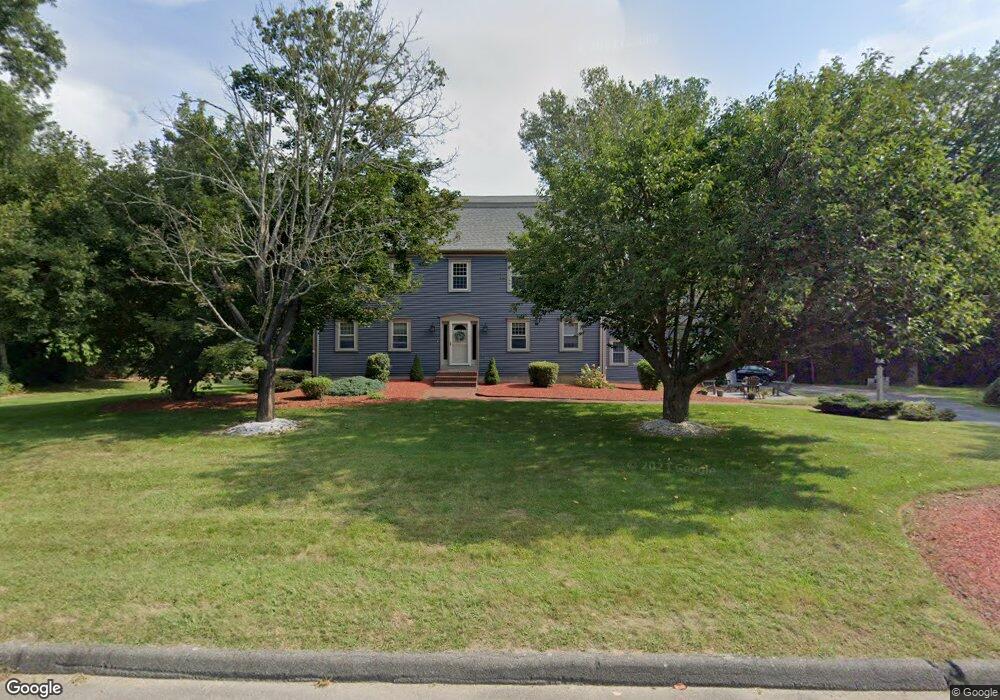
2 Fawn Rd Medway, MA 02053
Estimated Value: $815,264 - $986,000
4
Beds
3
Baths
2,896
Sq Ft
$314/Sq Ft
Est. Value
About This Home
This home is located at 2 Fawn Rd, Medway, MA 02053 and is currently estimated at $908,566, approximately $313 per square foot. 2 Fawn Rd is a home located in Norfolk County with nearby schools including John D. McGovern Elementary School, Burke-Memorial Elementary, and Medway Middle School.
Ownership History
Date
Name
Owned For
Owner Type
Purchase Details
Closed on
Jun 30, 2005
Sold by
Hinkley Bruce E and Hinkley Virginia A
Bought by
Reynolds Neil G and Reynolds Sally J
Current Estimated Value
Home Financials for this Owner
Home Financials are based on the most recent Mortgage that was taken out on this home.
Original Mortgage
$245,000
Outstanding Balance
$128,471
Interest Rate
5.73%
Mortgage Type
Purchase Money Mortgage
Estimated Equity
$780,095
Create a Home Valuation Report for This Property
The Home Valuation Report is an in-depth analysis detailing your home's value as well as a comparison with similar homes in the area
Home Values in the Area
Average Home Value in this Area
Purchase History
| Date | Buyer | Sale Price | Title Company |
|---|---|---|---|
| Reynolds Neil G | $585,000 | -- |
Source: Public Records
Mortgage History
| Date | Status | Borrower | Loan Amount |
|---|---|---|---|
| Open | Reynolds Neil G | $245,000 |
Source: Public Records
Tax History Compared to Growth
Tax History
| Year | Tax Paid | Tax Assessment Tax Assessment Total Assessment is a certain percentage of the fair market value that is determined by local assessors to be the total taxable value of land and additions on the property. | Land | Improvement |
|---|---|---|---|---|
| 2025 | $10,810 | $758,600 | $342,000 | $416,600 |
| 2024 | $10,924 | $758,600 | $342,000 | $416,600 |
| 2023 | $10,841 | $680,100 | $311,500 | $368,600 |
| 2022 | $9,973 | $589,100 | $230,900 | $358,200 |
| 2021 | $10,029 | $574,400 | $215,600 | $358,800 |
| 2020 | $9,998 | $571,300 | $215,600 | $355,700 |
| 2019 | $9,327 | $549,600 | $206,900 | $342,700 |
| 2018 | $9,406 | $532,600 | $198,200 | $334,400 |
| 2017 | $9,171 | $511,800 | $193,900 | $317,900 |
| 2016 | $8,789 | $485,300 | $178,600 | $306,700 |
| 2015 | $8,717 | $477,900 | $176,400 | $301,500 |
| 2014 | $8,028 | $426,100 | $178,700 | $247,400 |
Source: Public Records
Map
Nearby Homes
- 78 Fisher St
- 4 Deerfield Rd
- 85 Fisher St
- 6 Rainbow Dr
- 22 Granite St
- 9 Tulip Way
- 39 West St
- 6 Freedom Trail
- 190-194 E Main St
- 0 Old Log Lane (Farm St) Unit 73416329
- 462 Hartford Ave
- 5 Fales St
- 12 Longmeadow Ln
- 455 Hartford Ave
- 220 Main St Unit 220
- 56 Paul Rd
- 11 Black Bear Unit 11
- 9 Black Bear Cir Unit 9
- 176 Main St Unit 3
- 48 Black Bear Cir Unit 48