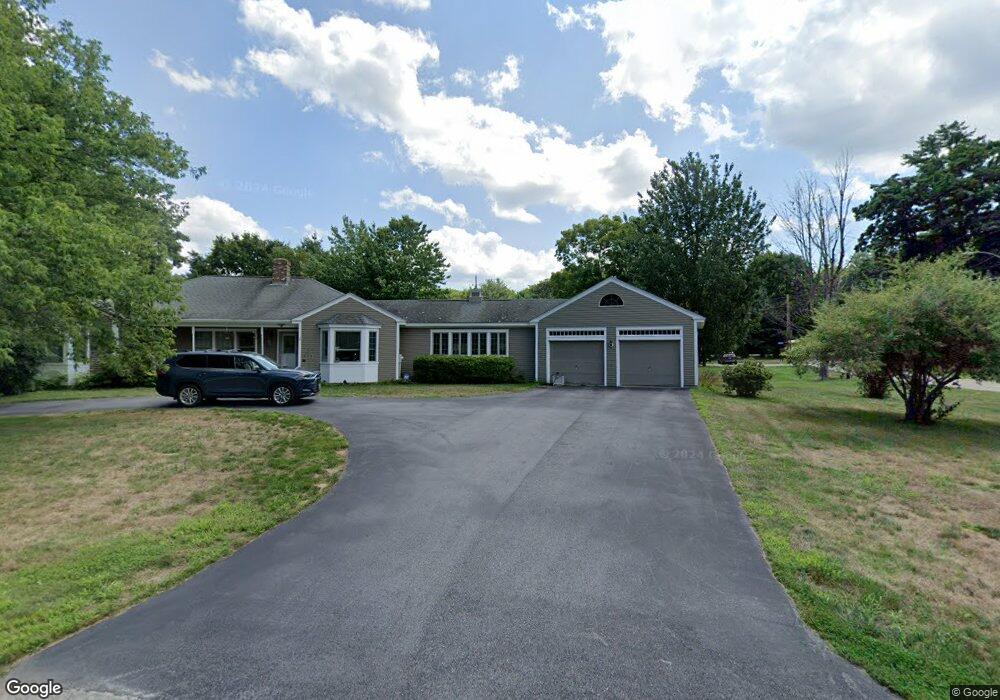
2 Ferry Ln Biddeford, ME 04005
South Biddeford NeighborhoodEstimated Value: $687,567 - $902,000
2
Beds
3
Baths
2,748
Sq Ft
$294/Sq Ft
Est. Value
About This Home
This home is located at 2 Ferry Ln, Biddeford, ME 04005 and is currently estimated at $807,642, approximately $293 per square foot. 2 Ferry Ln is a home located in York County with nearby schools including John F Kennedy Memorial School, Biddeford Primary School, and Biddeford Intermediate School.
Ownership History
Date
Name
Owned For
Owner Type
Purchase Details
Closed on
Jan 14, 2025
Sold by
Russell Kathleen E and Russell Peter D
Bought by
Russell Bradley W
Current Estimated Value
Purchase Details
Closed on
Aug 25, 2008
Sold by
Gearan William K
Bought by
Russell Peter D and Russell Kathleen E
Create a Home Valuation Report for This Property
The Home Valuation Report is an in-depth analysis detailing your home's value as well as a comparison with similar homes in the area
Home Values in the Area
Average Home Value in this Area
Purchase History
| Date | Buyer | Sale Price | Title Company |
|---|---|---|---|
| Russell Bradley W | -- | None Available | |
| Russell Bradley W | -- | None Available | |
| Russell Bradley W | -- | None Available | |
| Russell Peter D | -- | -- | |
| Russell Peter D | -- | -- |
Source: Public Records
Mortgage History
| Date | Status | Borrower | Loan Amount |
|---|---|---|---|
| Previous Owner | Russell Peter D | $150,000 | |
| Previous Owner | Russell Peter D | $100,000 |
Source: Public Records
Tax History
| Year | Tax Paid | Tax Assessment Tax Assessment Total Assessment is a certain percentage of the fair market value that is determined by local assessors to be the total taxable value of land and additions on the property. | Land | Improvement |
|---|---|---|---|---|
| 2025 | $8,546 | $572,000 | $186,300 | $385,700 |
| 2024 | $8,094 | $569,200 | $186,300 | $382,900 |
| 2023 | $7,427 | $566,100 | $183,200 | $382,900 |
| 2022 | $8,044 | $490,200 | $113,900 | $376,300 |
| 2021 | $7,206 | $420,300 | $98,200 | $322,100 |
| 2020 | $7,607 | $379,400 | $82,800 | $296,600 |
| 2019 | $7,580 | $379,400 | $82,800 | $296,600 |
| 2018 | $3,797 | $379,400 | $82,800 | $296,600 |
| 2017 | $6,846 | $341,100 | $82,800 | $258,300 |
| 2016 | $6,774 | $341,100 | $82,800 | $258,300 |
| 2015 | $6,447 | $341,100 | $82,800 | $258,300 |
| 2014 | $6,238 | $338,500 | $82,800 | $255,700 |
| 2013 | -- | $363,000 | $87,300 | $275,700 |
Source: Public Records
Map
Nearby Homes
- 650 Pool St
- 625 Pool St
- 5 Twin Island Dr
- 26 Meeting House Rd
- 18 Camp Ellis Ave
- 1 Main Ave
- 10 Lower Beach Rd
- 74 Guinea Rd
- 4 Walker Dr Unit 101
- 3 Walker Dr Unit 101
- 3 Walker Dr Unit 101
- 9 Riverside Ave
- TBD 530 Ferry Rd
- 9 Windward Ridge
- 378 Pool St
- 295 Ferry Rd
- 353 Pool St
- 5 Red Oak Ln
- 8 Rockwood Dr
- 30 Vines Rd
Your Personal Tour Guide
Ask me questions while you tour the home.