2 Ferry Ln Biddeford, ME 04005
South Biddeford NeighborhoodEstimated Value: $676,312 - $805,000
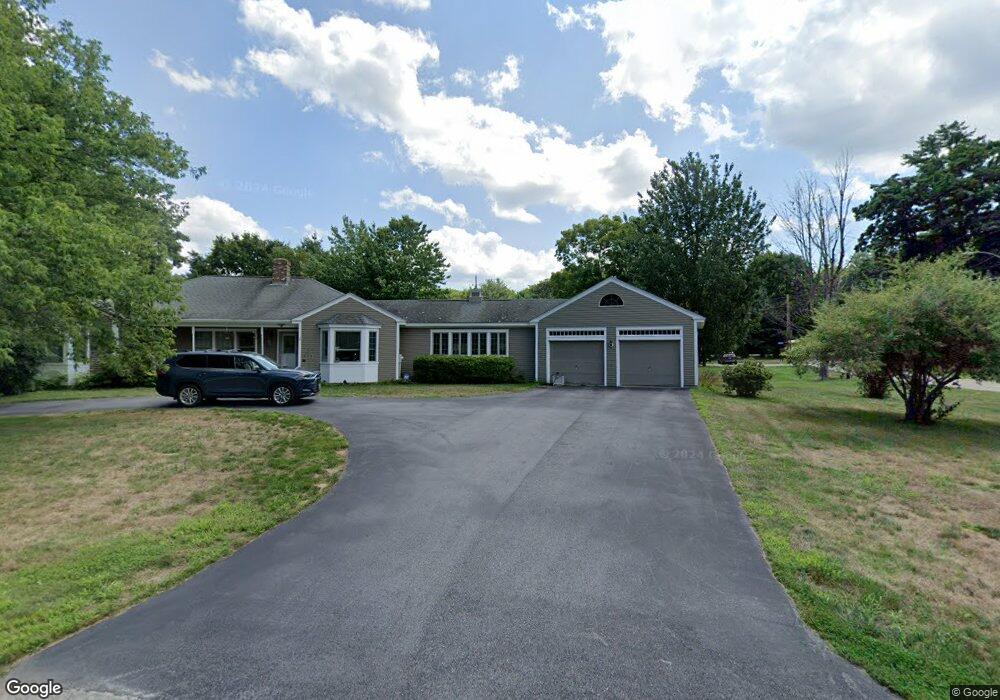
About This Home
This home is located at 2 Ferry Ln, Biddeford, ME 04005 and is currently estimated at $715,078, approximately $260 per square foot. 2 Ferry Ln is a home located in York County with nearby schools including John F Kennedy Memorial School, Biddeford Primary School, and Biddeford Intermediate School.
Ownership History
We collect this data history from publicly available records. To have your information removed, we recommend requesting removal directly through your county’s website.
Purchase Details
Purchase Details
Home Values in the Area
Average Home Value in this Area
Purchase History
We collect this data history from publicly available records. To have your information removed, we recommend requesting removal directly through your county’s website.
| Date | Buyer | Sale Price | Title Company |
|---|---|---|---|
| -- | None Available | ||
| -- | None Available | ||
| -- | None Available | ||
| -- | -- | ||
| -- | -- |
Mortgage History
We collect this data history from publicly available records. To have your information removed, we recommend requesting removal directly through your county’s website.
| Date | Status | Borrower | Loan Amount |
|---|---|---|---|
| Previous Owner | $150,000 | ||
| Previous Owner | $100,000 |
Tax History
We collect this data history from publicly available records. To have your information removed, we recommend requesting removal directly through your county’s website.
| Year | Tax Paid | Tax Assessment Tax Assessment Total Assessment is a certain percentage of the fair market value that is determined by local assessors to be the total taxable value of land and additions on the property. | Land | Improvement |
|---|---|---|---|---|
| 2025 | $8,546 | $572,000 | $186,300 | $385,700 |
| 2024 | $8,094 | $569,200 | $186,300 | $382,900 |
| 2023 | $7,427 | $566,100 | $183,200 | $382,900 |
| 2022 | $8,044 | $490,200 | $113,900 | $376,300 |
| 2021 | $7,206 | $420,300 | $98,200 | $322,100 |
| 2020 | $7,607 | $379,400 | $82,800 | $296,600 |
| 2019 | $7,580 | $379,400 | $82,800 | $296,600 |
| 2018 | $3,797 | $379,400 | $82,800 | $296,600 |
| 2017 | $6,846 | $341,100 | $82,800 | $258,300 |
| 2016 | $6,774 | $341,100 | $82,800 | $258,300 |
| 2015 | $6,447 | $341,100 | $82,800 | $258,300 |
| 2014 | $6,238 | $338,500 | $82,800 | $255,700 |
| 2013 | -- | $363,000 | $87,300 | $275,700 |
Map
- 460 Pool St
- 650 Pool St
- 625 Pool St
- 527 Pool St
- 446 Pool St
- 22 Crestwood Dr
- 26 Meeting House Rd
- 3 Island View Ave
- 15 Bayview Rd
- 10 Lower Beach Rd
- 4 Walker Dr Unit 101
- 3 Walker Dr Unit 101
- 3 Walker Dr Unit 101
- 15 King Ave
- 10 Lighthouse Ln
- 31 Sunset Ave
- TBD 530 Ferry Rd
- 378 Pool St
- 9 Windward Ridge
- 353 Pool St
Ask me questions while you tour the home.