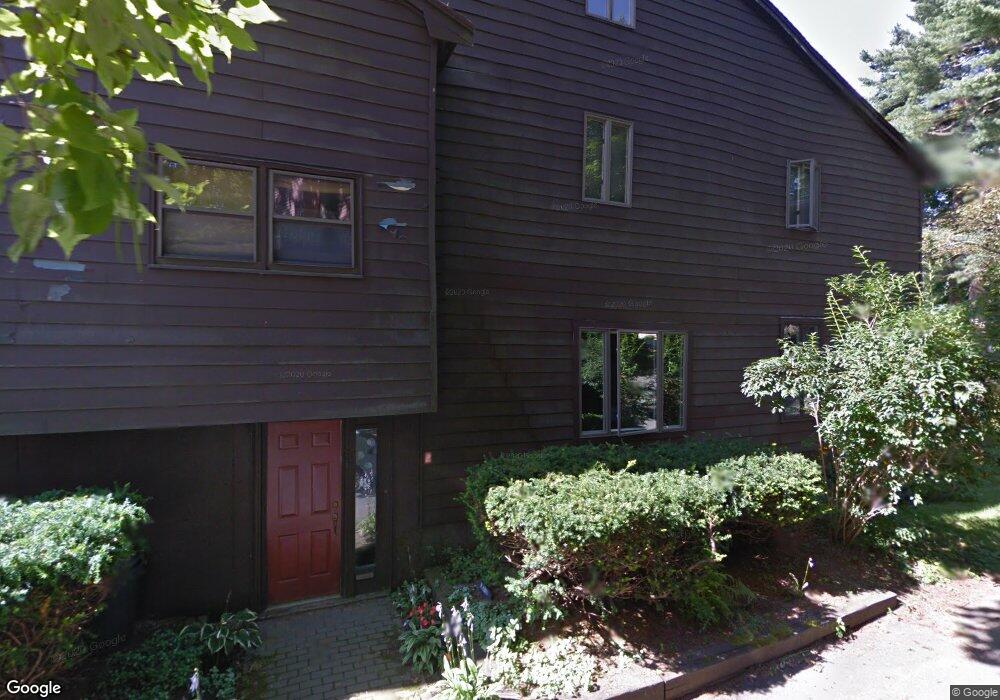
2 Foss Terrace Marblehead, MA 01945
Estimated Value: $846,416 - $1,056,000
3
Beds
2
Baths
2,424
Sq Ft
$400/Sq Ft
Est. Value
About This Home
This home is located at 2 Foss Terrace, Marblehead, MA 01945 and is currently estimated at $968,854, approximately $399 per square foot. 2 Foss Terrace is a home located in Essex County with nearby schools including Marblehead High School, Marblehead Community Charter Public School, and Devereux School.
Ownership History
Date
Name
Owned For
Owner Type
Purchase Details
Closed on
Apr 1, 2019
Sold by
Rabin Kathy N and Rabin Paul
Bought by
Smith Andrew R and Smith Robin C
Current Estimated Value
Purchase Details
Closed on
Jul 11, 1977
Bought by
Rabin Paul and Rabin Kathy N
Create a Home Valuation Report for This Property
The Home Valuation Report is an in-depth analysis detailing your home's value as well as a comparison with similar homes in the area
Home Values in the Area
Average Home Value in this Area
Purchase History
| Date | Buyer | Sale Price | Title Company |
|---|---|---|---|
| Smith Andrew R | -- | -- | |
| Smith Andrew R | -- | -- | |
| Smith Andrew R | -- | -- | |
| Rabin Paul | -- | -- |
Source: Public Records
Mortgage History
| Date | Status | Borrower | Loan Amount |
|---|---|---|---|
| Previous Owner | Rabin Paul | $200,000 | |
| Previous Owner | Rabin Paul | $100,000 | |
| Previous Owner | Rabin Paul | $55,000 | |
| Previous Owner | Rabin Paul | $100,000 |
Source: Public Records
Tax History Compared to Growth
Tax History
| Year | Tax Paid | Tax Assessment Tax Assessment Total Assessment is a certain percentage of the fair market value that is determined by local assessors to be the total taxable value of land and additions on the property. | Land | Improvement |
|---|---|---|---|---|
| 2025 | $7,099 | $784,400 | $537,200 | $247,200 |
| 2024 | $6,610 | $737,700 | $513,300 | $224,400 |
| 2023 | $6,919 | $691,900 | $489,400 | $202,500 |
| 2022 | $6,176 | $587,100 | $399,900 | $187,200 |
| 2021 | $5,891 | $565,400 | $382,000 | $183,400 |
| 2020 | $5,582 | $537,200 | $382,000 | $155,200 |
| 2019 | $5,385 | $501,400 | $346,200 | $155,200 |
| 2018 | $5,262 | $477,500 | $322,300 | $155,200 |
| 2017 | $4,863 | $441,700 | $286,500 | $155,200 |
| 2016 | $4,771 | $429,800 | $274,600 | $155,200 |
| 2015 | $4,659 | $420,500 | $262,600 | $157,900 |
| 2014 | $4,244 | $382,700 | $226,800 | $155,900 |
Source: Public Records
Map
Nearby Homes
- 24 Russell St
- 37 Peach Highlands
- 45 Peach Highlands
- 75 Pond St
- 33 Intrepid Cir Unit 208
- 29 High St
- 25 Pearl St
- 3 Frost Ln Unit 1
- 8 Franklin St Unit 19
- 45 Washington St Unit 3
- 20 Mechanic Square Unit 2
- 20 Mechanic Square Unit 3
- 1 Green St Unit 2
- 31 Lincoln Park
- 108 Front St
- 45 Pleasant St
- 51 Lincoln Ave
- 105 Green St Unit 4
- 132 Elm St
- 132 Elm St Unit 132
- 10 Hillside Ave
- 10 Hillside Ave Unit 2
- 3 Foss Terrace
- 3 Foss Terrace Unit 3
- 3 Foss Terrace Unit 1
- 0 Foss Terrace
- 12 Hillside Ave
- 5 Foss Terrace
- 5 Foss Terrace Unit 1
- 8 Hillside Ave
- 3 Peach Highlands
- 8 Foss Terrace
- 8 Foss Terrace Unit 1
- 15 Hillside Ave
- 15 Hillside Ave Unit 1
- 15 Hillside Ave Unit 2
- 18 Hillside Ave
- 3R Peach Highlands
- 9 Hillside Ave Unit 1
- 9 Hillside Ave Unit 4