Estimated Value: $613,610 - $770,000
--
Bed
1
Bath
4,428
Sq Ft
$161/Sq Ft
Est. Value
About This Home
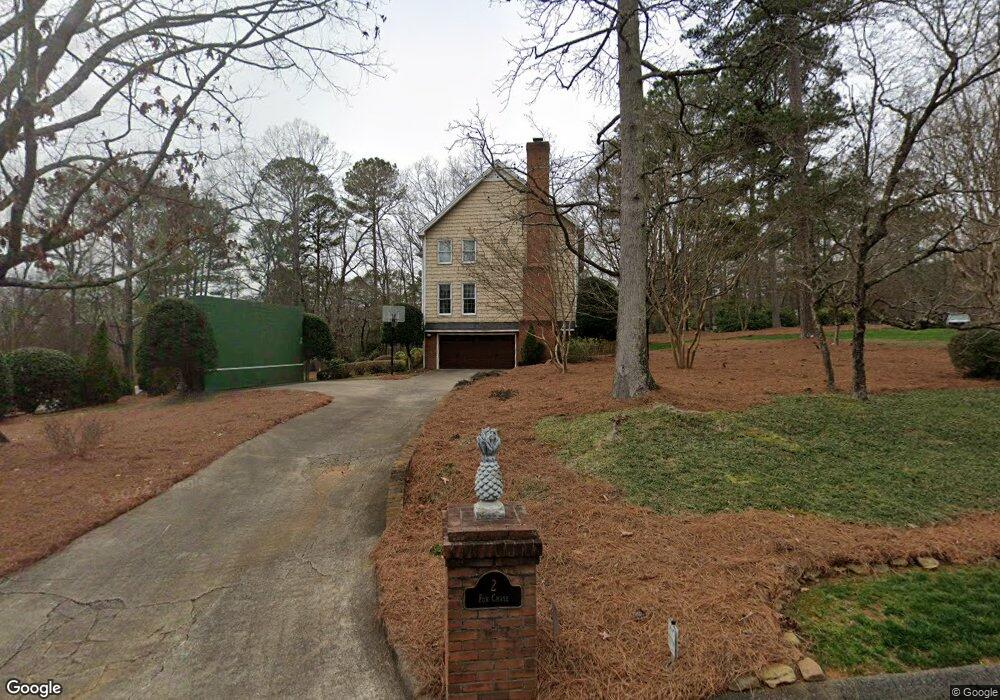
This home is located at 2 Fox Chase SW, Rome, GA 30165 and is currently estimated at $711,537, approximately $160 per square foot. 2 Fox Chase SW is a home located in Floyd County with nearby schools including Coosa Middle School and Coosa High School.
Ownership History
Date
Name
Owned For
Owner Type
Purchase Details
Closed on
Mar 12, 2001
Sold by
Ashmore Michael E and Ashmore Lesa C
Bought by
Dinatti Louis A and Dinat Carol L
Current Estimated Value
Purchase Details
Closed on
Sep 2, 1986
Sold by
M D Professional Assoc Defined Benefits
Bought by
Ashmore Michael E and Ashmore Lesa C
Purchase Details
Closed on
Oct 25, 1984
Sold by
P\R
Bought by
M D Professional Assoc Defined Benefits
Purchase Details
Closed on
Jun 14, 1984
Sold by
P\R
Bought by
P\R
Purchase Details
Closed on
May 14, 1984
Sold by
P\R
Bought by
P\R
Purchase Details
Closed on
Mar 21, 1984
Sold by
Toles Temple Wright Inc 1\3 & Robinson W
Bought by
P\R
Purchase Details
Closed on
Mar 1, 1984
Sold by
Toles Temple Wright Inc 1\3 & Robinson W
Bought by
Toles Temple Wright Inc 1\3 & Robinson W
Purchase Details
Closed on
Nov 19, 1982
Bought by
Toles Temple Wright Inc 1\3 & Robinson W
Create a Home Valuation Report for This Property
The Home Valuation Report is an in-depth analysis detailing your home's value as well as a comparison with similar homes in the area
Home Values in the Area
Average Home Value in this Area
Purchase History
| Date | Buyer | Sale Price | Title Company |
|---|---|---|---|
| Dinatti Louis A | $426,000 | -- | |
| Ashmore Michael E | $21,200 | -- | |
| M D Professional Assoc Defined Benefits | $153,000 | -- | |
| P\R | -- | -- | |
| P\R | -- | -- | |
| P\R | -- | -- | |
| Toles Temple Wright Inc 1\3 & Robinson W | -- | -- | |
| Toles Temple Wright Inc 1\3 & Robinson W | -- | -- |
Source: Public Records
Tax History Compared to Growth
Tax History
| Year | Tax Paid | Tax Assessment Tax Assessment Total Assessment is a certain percentage of the fair market value that is determined by local assessors to be the total taxable value of land and additions on the property. | Land | Improvement |
|---|---|---|---|---|
| 2024 | $6,421 | $273,643 | $37,113 | $236,530 |
| 2023 | $6,454 | $263,878 | $33,739 | $230,139 |
| 2022 | $5,761 | $220,658 | $27,835 | $192,823 |
| 2021 | $5,528 | $202,830 | $27,835 | $174,995 |
| 2020 | $5,297 | $188,211 | $21,087 | $167,124 |
| 2019 | $5,082 | $180,036 | $21,087 | $158,949 |
| 2018 | $4,932 | $171,517 | $21,087 | $150,430 |
| 2017 | $4,899 | $169,168 | $21,087 | $148,081 |
| 2016 | $4,912 | $166,640 | $21,080 | $145,560 |
| 2015 | $4,885 | $168,600 | $21,080 | $147,520 |
| 2014 | $4,885 | $170,309 | $21,080 | $149,229 |
Source: Public Records
Map
Nearby Homes
- 21 River Pine Dr SW
- 0 Belle Meade Dr SW Unit 10504645
- 5 Saint Andrews Way SW
- 30 Fairview Dr SW
- 186 Fairview Dr SW
- 0 Radio Springs Rd SW Unit 10587642
- 0 Radio Springs Rd SW Unit 10587644
- 0 Radio Springs Rd SW Unit 10587646
- 11 Brow Rd SW
- 0 Hidden Ridge Dr Unit 10343694
- 0 Hidden Ridge Dr Unit 10343706
- 0 Hidden Ridge Dr Unit 10343701
- 0 Hidden Ridge Dr Unit 10343693
- 0 Hidden Ridge Dr Unit 10343685
- 0 Hidden Ridge Dr Unit 10556470
- 0 Hidden Ridge Dr Unit 10343688
- 0 Hidden Ridge Dr Unit 10343680
- 0 Hidden Ridge Dr Unit 10343696
- 0 Hidden Ridge Dr Unit 10343689
- 0 Hidden Ridge Dr Unit 10343700
- 12 River Pine Dr SW
- 4 Fox Chase SW
- 1 Fox Chase SW
- 9 River Pine Dr SW
- 6 Fox Chase SW
- 10 River Pine Dr SW
- 11 River Pine Dr SW
- 5 Fox Chase SW
- 7 River Pine Dr SW Unit LOT 27
- 7 River Pine Dr SW
- 21 River Place Dr SW
- 8 River Pine Dr SW
- 8 River Pine Dr SW
- 8 Fox Chase SW
- 14 River Pine Dr SW
- 14 River Pine Dr SW
- 15 River Pine Dr SW
- 11 River Place Dr SW
- 22 River Place Dr SW
- 10 Fox Chase SW