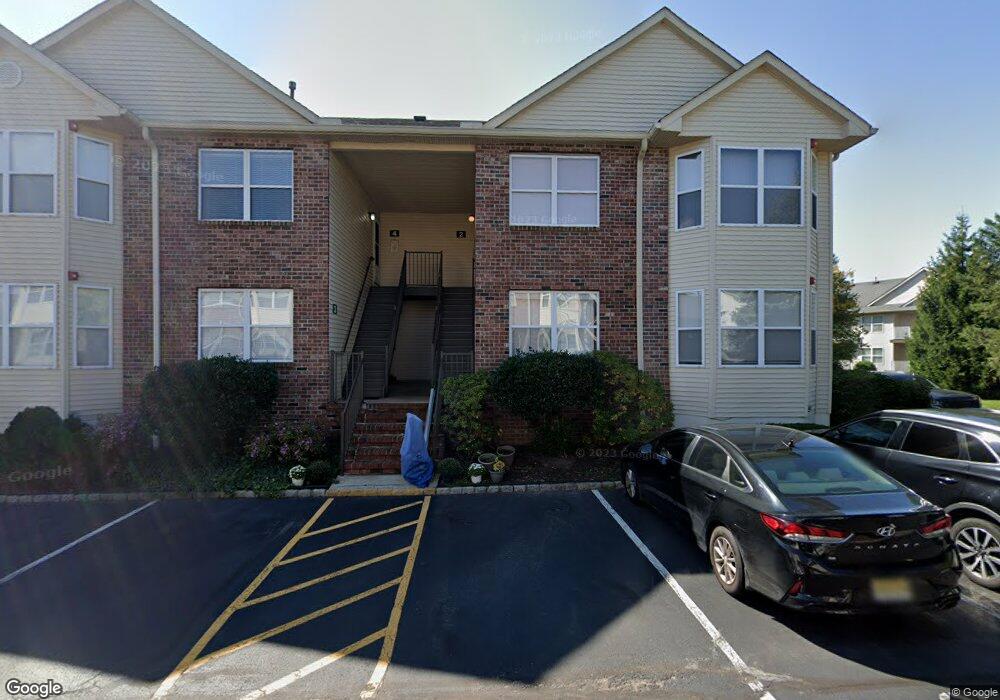
2 Frankie Ln Unit 3102 East Hanover, NJ 07936
Estimated Value: $490,958 - $534,000
--
Bed
--
Bath
1,457
Sq Ft
$352/Sq Ft
Est. Value
About This Home
This home is located at 2 Frankie Ln Unit 3102, East Hanover, NJ 07936 and is currently estimated at $512,240, approximately $351 per square foot. 2 Frankie Ln Unit 3102 is a home located in Morris County with nearby schools including Frank J. Smith Elementary School, Central Elementary School, and East Hanover Middle School.
Ownership History
Date
Name
Owned For
Owner Type
Purchase Details
Closed on
Dec 30, 2010
Sold by
Wong Shirley S Q Yee
Bought by
Wong Shirley S Q Yee and Ng Vivian Wong
Current Estimated Value
Purchase Details
Closed on
Aug 24, 2001
Sold by
Demartini Dina
Bought by
Wong Joe and Wong Shirley
Home Financials for this Owner
Home Financials are based on the most recent Mortgage that was taken out on this home.
Original Mortgage
$170,000
Interest Rate
6.86%
Purchase Details
Closed on
Aug 19, 1996
Sold by
Milelli Mary E and Milelli David M
Bought by
Demartini Michael W
Home Financials for this Owner
Home Financials are based on the most recent Mortgage that was taken out on this home.
Original Mortgage
$149,400
Interest Rate
8.4%
Purchase Details
Closed on
Aug 27, 1993
Sold by
Park Hanover
Bought by
Bock Mary and Milelli David
Home Financials for this Owner
Home Financials are based on the most recent Mortgage that was taken out on this home.
Original Mortgage
$117,000
Interest Rate
7.16%
Create a Home Valuation Report for This Property
The Home Valuation Report is an in-depth analysis detailing your home's value as well as a comparison with similar homes in the area
Home Values in the Area
Average Home Value in this Area
Purchase History
| Date | Buyer | Sale Price | Title Company |
|---|---|---|---|
| Wong Shirley S Q Yee | -- | None Available | |
| Wong Joe | $248,000 | -- | |
| Demartini Michael W | $166,000 | -- | |
| Bock Mary | $129,900 | -- |
Source: Public Records
Mortgage History
| Date | Status | Borrower | Loan Amount |
|---|---|---|---|
| Previous Owner | Wong Joe | $170,000 | |
| Previous Owner | Demartini Michael W | $149,400 | |
| Previous Owner | Bock Mary | $117,000 |
Source: Public Records
Tax History Compared to Growth
Tax History
| Year | Tax Paid | Tax Assessment Tax Assessment Total Assessment is a certain percentage of the fair market value that is determined by local assessors to be the total taxable value of land and additions on the property. | Land | Improvement |
|---|---|---|---|---|
| 2025 | $5,512 | $212,500 | $95,000 | $117,500 |
| 2024 | $5,302 | $212,500 | $95,000 | $117,500 |
| 2023 | $5,302 | $212,500 | $95,000 | $117,500 |
| 2022 | $5,181 | $212,500 | $95,000 | $117,500 |
| 2021 | $5,181 | $212,500 | $95,000 | $117,500 |
| 2020 | $5,079 | $212,500 | $95,000 | $117,500 |
| 2019 | $4,985 | $212,500 | $95,000 | $117,500 |
| 2018 | $4,834 | $212,500 | $95,000 | $117,500 |
| 2017 | $4,677 | $212,500 | $95,000 | $117,500 |
| 2016 | $4,613 | $212,500 | $95,000 | $117,500 |
| 2015 | $4,548 | $212,500 | $95,000 | $117,500 |
| 2014 | $4,450 | $212,500 | $95,000 | $117,500 |
Source: Public Records
Map
Nearby Homes
- 16 Claire Ct
- 29 Beach St
- 4 Justin Dr
- 50 River Rd
- 46 Eastwood Terrace Unit 55
- 7 Eastwood Terrace
- Birch Plan at Valley View Park - The Signature Collection
- Pershing Plan at Valley View Park - The Pershing Collection
- Monterey Plan at Valley View Park - The Monterey Collection
- Maple Plan at Valley View Park - The Signature Collection
- 4 Eastwood Terrace
- 68 Eastwood Terrace
- 65 Eastwood Terrace
- 67 Eastwood Terrace
- 69 Eastwood Terrace
- 83 Ventura Dr Unit 67
- 62 Eastwood Terrace
- 89 Ventura Dr
- 32 Ridge Dr
- 74 Fairway Dr
- 1 Frankie Ln
- 3 Frankie Ln Unit 3103
- 4 Frankie Ln
- 5 Frankie Ln Unit 3105
- 6 Frankie Ln Unit 3106
- 7 Frankie Ln Unit 3107
- 32 Ruby Ln Unit 2308
- 8 Frankie Ln
- 31 Ruby Ln Unit 2307
- 17 Claire Ct
- 25 Frankie Ln Unit 3207
- 23 Frankie Ln
- 30 Ruby Ln Unit 2306
- 18 Claire Ct Unit 2802
- 26 Frankie Ln
- 29 Ruby Ln Unit 2305
- 24 Frankie Ln Unit 3206
- 21 Frankie Ln
- 21 Joseph Dr
- 19 Claire Ct Unit 2803