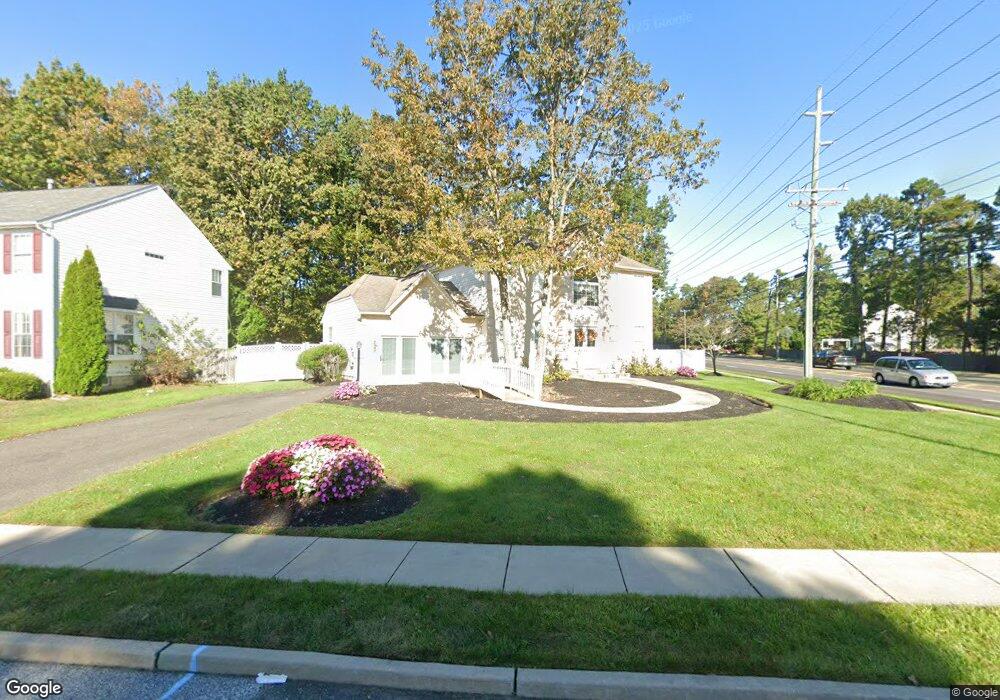
2 Franklin Ln Sicklerville, NJ 08081
Winslow Township NeighborhoodEstimated Value: $452,000 - $534,000
--
Bed
--
Bath
2,641
Sq Ft
$186/Sq Ft
Est. Value
About This Home
This home is located at 2 Franklin Ln, Sicklerville, NJ 08081 and is currently estimated at $492,446, approximately $186 per square foot. 2 Franklin Ln is a home located in Camden County with nearby schools including Winslow Township High School, Erial Community Church Christian School, and South Jersey Christian Academy.
Ownership History
Date
Name
Owned For
Owner Type
Purchase Details
Closed on
Aug 11, 2003
Sold by
Holman Susan T
Bought by
James Susan T and James Herbert L
Current Estimated Value
Home Financials for this Owner
Home Financials are based on the most recent Mortgage that was taken out on this home.
Original Mortgage
$224,000
Interest Rate
6.25%
Purchase Details
Closed on
Jul 26, 2001
Sold by
Sallstrom Roy B
Bought by
Holman Susan T
Home Financials for this Owner
Home Financials are based on the most recent Mortgage that was taken out on this home.
Original Mortgage
$176,000
Interest Rate
7.21%
Purchase Details
Closed on
Sep 25, 1998
Sold by
Cwr Construction Inc
Bought by
Sallstrom Roy B and Sallstrom Judith L
Home Financials for this Owner
Home Financials are based on the most recent Mortgage that was taken out on this home.
Original Mortgage
$153,600
Interest Rate
6.89%
Create a Home Valuation Report for This Property
The Home Valuation Report is an in-depth analysis detailing your home's value as well as a comparison with similar homes in the area
Home Values in the Area
Average Home Value in this Area
Purchase History
| Date | Buyer | Sale Price | Title Company |
|---|---|---|---|
| James Susan T | -- | -- | |
| Holman Susan T | $220,000 | -- | |
| Sallstrom Roy B | $192,000 | -- |
Source: Public Records
Mortgage History
| Date | Status | Borrower | Loan Amount |
|---|---|---|---|
| Previous Owner | James Susan T | $224,000 | |
| Previous Owner | Holman Susan T | $176,000 | |
| Previous Owner | Sallstrom Roy B | $153,600 |
Source: Public Records
Tax History Compared to Growth
Tax History
| Year | Tax Paid | Tax Assessment Tax Assessment Total Assessment is a certain percentage of the fair market value that is determined by local assessors to be the total taxable value of land and additions on the property. | Land | Improvement |
|---|---|---|---|---|
| 2025 | $8,807 | $241,500 | $50,000 | $207,300 |
| 2024 | $9,175 | $225,700 | $50,000 | $191,500 |
| 2023 | $9,175 | $241,500 | $50,000 | $191,500 |
| 2022 | $8,892 | $241,500 | $50,000 | $191,500 |
| 2021 | $8,791 | $241,500 | $50,000 | $191,500 |
| 2020 | $8,713 | $241,500 | $50,000 | $191,500 |
| 2019 | $8,660 | $241,500 | $50,000 | $191,500 |
| 2018 | $8,542 | $241,500 | $50,000 | $191,500 |
| 2017 | $8,390 | $241,500 | $50,000 | $191,500 |
| 2016 | $8,283 | $241,500 | $50,000 | $191,500 |
| 2015 | $8,163 | $241,500 | $50,000 | $191,500 |
| 2014 | $7,982 | $241,500 | $50,000 | $191,500 |
Source: Public Records
Map
Nearby Homes
- 5 Kelly Dr
- 30 Champlain St
- 45 Wiltons Landing Rd
- 6 Goose Neck Ln
- LAFAYETTE Plan at
- 50 Wildcat Branch Dr
- 163 Sandy Ridge Rd
- 113 Clinton St
- 159 Sandy Ridge Rd
- 119 Clinton St
- 161 Sandy Ridge Rd
- 115 Clinton St
- 111 Clinton St
- 196 Sandy Ridge Rd
- 6 Twisting Ln
- 7 Elsworth Ct
- 161 Ciseley Dr
- 47 Wagon Wheel Dr
- 117 Clinton St
- 29 Wagon Wheel Dr