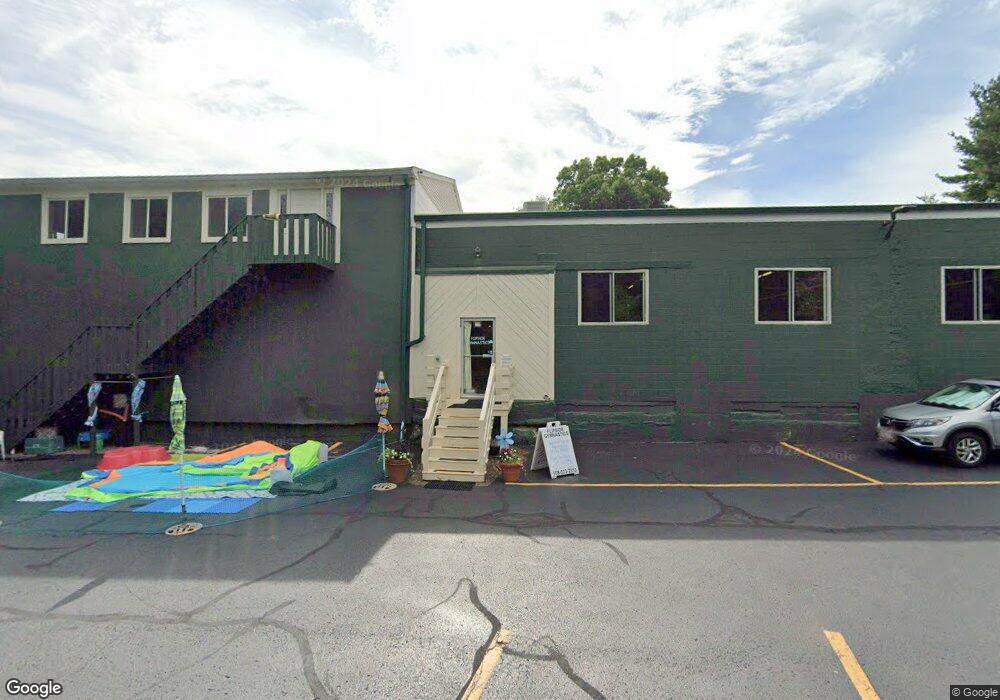
2 Franklin St Medway, MA 02053
Estimated Value: $1,243,679
2
Beds
--
Bath
12,670
Sq Ft
$98/Sq Ft
Est. Value
About This Home
This home is located at 2 Franklin St, Medway, MA 02053 and is currently estimated at $1,243,679, approximately $98 per square foot. 2 Franklin St is a home located in Norfolk County with nearby schools including John D. McGovern Elementary School, Burke-Memorial Elementary, and Medway Middle School.
Ownership History
Date
Name
Owned For
Owner Type
Purchase Details
Closed on
May 21, 2010
Sold by
Woodstructure Constr I
Bought by
Santosuosso Paul J
Current Estimated Value
Home Financials for this Owner
Home Financials are based on the most recent Mortgage that was taken out on this home.
Original Mortgage
$532,915
Outstanding Balance
$360,672
Interest Rate
5.25%
Mortgage Type
FHA
Estimated Equity
$883,007
Purchase Details
Closed on
Aug 12, 2002
Sold by
Conca Albert
Bought by
Currier Ft
Purchase Details
Closed on
Aug 15, 1996
Sold by
Franklin St Rt
Bought by
Action Products Inc
Home Financials for this Owner
Home Financials are based on the most recent Mortgage that was taken out on this home.
Original Mortgage
$160,000
Interest Rate
8.08%
Mortgage Type
Commercial
Purchase Details
Closed on
May 7, 1992
Sold by
Davis Paul J
Bought by
Frankin St Rt
Home Financials for this Owner
Home Financials are based on the most recent Mortgage that was taken out on this home.
Original Mortgage
$30,000
Interest Rate
8.57%
Mortgage Type
Commercial
Create a Home Valuation Report for This Property
The Home Valuation Report is an in-depth analysis detailing your home's value as well as a comparison with similar homes in the area
Home Values in the Area
Average Home Value in this Area
Purchase History
| Date | Buyer | Sale Price | Title Company |
|---|---|---|---|
| Santosuosso Paul J | $545,000 | -- | |
| Currier Ft | $480,000 | -- | |
| Action Products Inc | $64,898 | -- | |
| Frankin St Rt | $30,000 | -- |
Source: Public Records
Mortgage History
| Date | Status | Borrower | Loan Amount |
|---|---|---|---|
| Open | Santosuosso Paul J | $532,915 | |
| Previous Owner | Frankin St Rt | $160,000 | |
| Previous Owner | Frankin St Rt | $30,000 |
Source: Public Records
Tax History Compared to Growth
Tax History
| Year | Tax Paid | Tax Assessment Tax Assessment Total Assessment is a certain percentage of the fair market value that is determined by local assessors to be the total taxable value of land and additions on the property. | Land | Improvement |
|---|---|---|---|---|
| 2025 | $7,366 | $516,900 | $218,700 | $298,200 |
| 2024 | $7,443 | $516,900 | $218,700 | $298,200 |
| 2023 | $8,105 | $508,500 | $218,700 | $289,800 |
| 2022 | $7,727 | $456,400 | $195,200 | $261,200 |
| 2021 | $7,969 | $456,400 | $173,500 | $282,900 |
| 2020 | $7,987 | $456,400 | $173,500 | $282,900 |
| 2019 | $7,745 | $456,400 | $173,500 | $282,900 |
| 2018 | $8,060 | $456,400 | $173,500 | $282,900 |
| 2017 | $8,179 | $456,400 | $173,500 | $282,900 |
| 2016 | $8,265 | $456,400 | $173,500 | $282,900 |
| 2015 | $8,452 | $463,400 | $173,500 | $289,900 |
| 2014 | $8,602 | $456,600 | $173,500 | $283,100 |
Source: Public Records
Map
Nearby Homes
- 220 Main St Unit 220
- 28 Wellington St
- 5 Fales St
- 21 Riverside Rd
- 176 Main St Unit 3
- 4 Shaw St
- 6 Freedom Trail
- 280 Village St Unit D2
- 18 Mary Anne Dr
- 462 Hartford Ave
- 951 Pond St
- 455 Hartford Ave
- 39 West St
- 14 Hawthorne Village Unit D
- 0 Old Log Lane (Farm St) Unit 73416329
- 0 Elm St
- 22 Sunset Dr
- 14 Heritage Dr
- 7 Gloucester Dr
- 387 Hartford Ave
- 2 Franklin St Unit A
- 21 Haverstock Rd
- 39 Waterview Dr
- 23 Haverstock Rd
- 0 Pond Unit 24285018
- 0 Pond Unit 70671648
- 40 Waterview Dr
- 6 Franklin St
- 27 Haverstock Rd
- 353 Village St
- 345 Village St
- 19 Haverstock Rd
- 27 Charles St
- 37 Waterview Dr
- 28 Sahlin Cir
- 355 Village St
- 18 Haverstock Rd
- 38 Waterview Dr
- 1391 Pond St
- Lot Stonehedge Rd