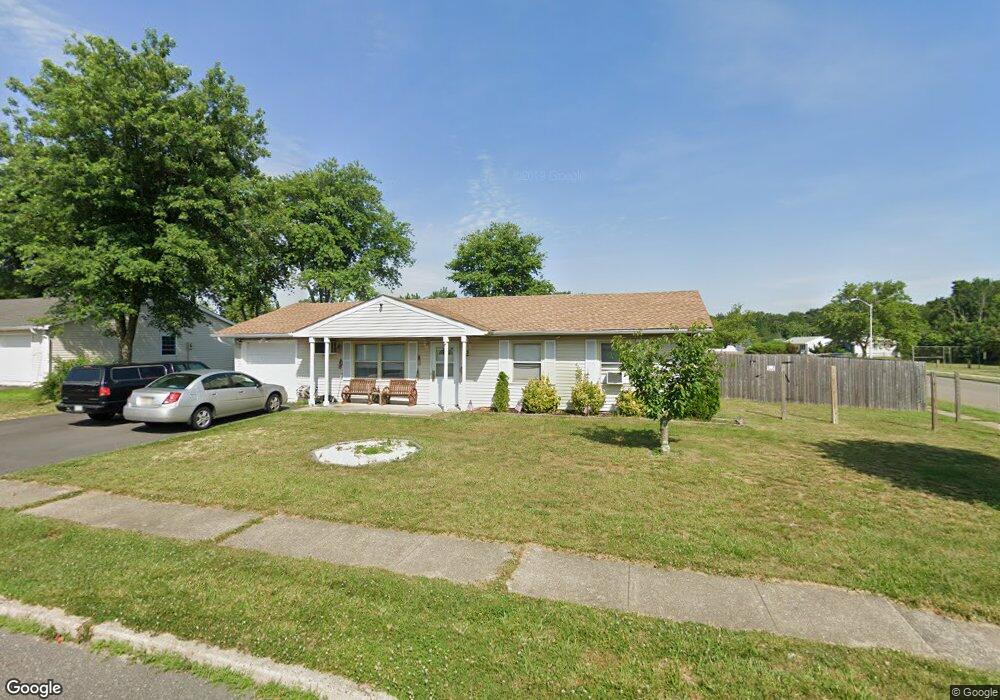
2 Fresno St Barnegat, NJ 08005
Barnegat Township NeighborhoodEstimated Value: $394,000 - $413,000
3
Beds
1
Bath
1,392
Sq Ft
$293/Sq Ft
Est. Value
About This Home
This home is located at 2 Fresno St, Barnegat, NJ 08005 and is currently estimated at $407,918, approximately $293 per square foot. 2 Fresno St is a home located in Ocean County with nearby schools including Barnegat High School.
Ownership History
Date
Name
Owned For
Owner Type
Purchase Details
Closed on
Dec 18, 2017
Sold by
Gamt Legal Title Trust 2013 A
Bought by
Greco Jay M
Current Estimated Value
Purchase Details
Closed on
Dec 31, 2004
Sold by
Lane Richard and Lane Karen M
Bought by
Hurle Kevin M and Hurle Carolyn
Home Financials for this Owner
Home Financials are based on the most recent Mortgage that was taken out on this home.
Original Mortgage
$193,500
Interest Rate
5.78%
Mortgage Type
Stand Alone First
Create a Home Valuation Report for This Property
The Home Valuation Report is an in-depth analysis detailing your home's value as well as a comparison with similar homes in the area
Home Values in the Area
Average Home Value in this Area
Purchase History
| Date | Buyer | Sale Price | Title Company |
|---|---|---|---|
| Greco Jay M | $100,000 | -- | |
| Hurle Kevin M | $215,000 | -- |
Source: Public Records
Mortgage History
| Date | Status | Borrower | Loan Amount |
|---|---|---|---|
| Previous Owner | Hurle Kevin M | $193,500 |
Source: Public Records
Tax History Compared to Growth
Tax History
| Year | Tax Paid | Tax Assessment Tax Assessment Total Assessment is a certain percentage of the fair market value that is determined by local assessors to be the total taxable value of land and additions on the property. | Land | Improvement |
|---|---|---|---|---|
| 2025 | $5,630 | $189,100 | $99,500 | $89,600 |
| 2024 | $5,505 | $189,100 | $99,500 | $89,600 |
| 2023 | $5,327 | $189,100 | $99,500 | $89,600 |
| 2022 | $5,327 | $189,100 | $99,500 | $89,600 |
| 2021 | $5,302 | $189,100 | $99,500 | $89,600 |
| 2020 | $5,278 | $189,100 | $99,500 | $89,600 |
| 2019 | $5,200 | $189,100 | $99,500 | $89,600 |
| 2018 | $5,161 | $189,100 | $99,500 | $89,600 |
| 2017 | $5,075 | $189,100 | $99,500 | $89,600 |
| 2016 | $4,971 | $189,100 | $99,500 | $89,600 |
| 2015 | $4,814 | $178,500 | $99,500 | $79,000 |
| 2014 | $4,429 | $178,500 | $99,500 | $79,000 |
Source: Public Records
Map
Nearby Homes