Estimated Value: $129,000 - $155,219
2
Beds
1
Bath
918
Sq Ft
$157/Sq Ft
Est. Value
About This Home
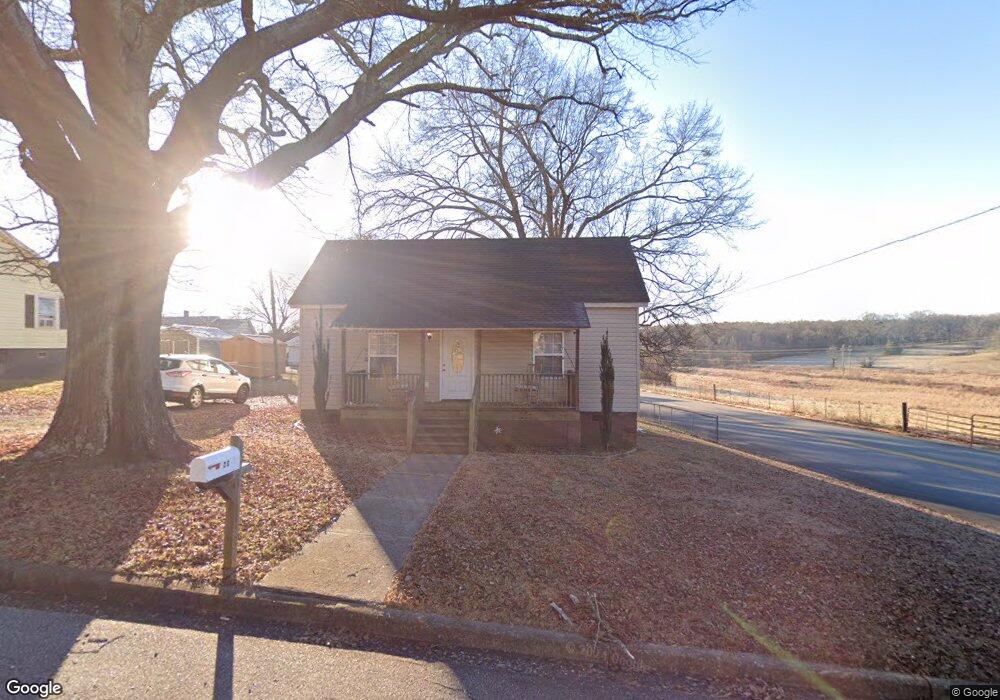
This home is located at 2 G St, Inman, SC 29349 and is currently estimated at $143,805, approximately $156 per square foot. 2 G St is a home located in Spartanburg County with nearby schools including Inman Elementary School, T.E. Mabry Middle School, and Chapman High School.
Ownership History
Date
Name
Owned For
Owner Type
Purchase Details
Closed on
Aug 11, 2014
Sold by
Holcombe Thomas Matthew
Bought by
Merrell Robin W
Current Estimated Value
Home Financials for this Owner
Home Financials are based on the most recent Mortgage that was taken out on this home.
Original Mortgage
$68,633
Outstanding Balance
$51,719
Interest Rate
3.8%
Mortgage Type
FHA
Estimated Equity
$92,086
Purchase Details
Closed on
Jan 10, 2014
Sold by
Foster Wanda Kay Frazier
Bought by
Holcombe Thomas Matthew
Purchase Details
Closed on
Nov 13, 2007
Sold by
Estate Of Lois Frazier and Foster Wanda K
Bought by
Foster Wanda Kay Frazier
Create a Home Valuation Report for This Property
The Home Valuation Report is an in-depth analysis detailing your home's value as well as a comparison with similar homes in the area
Home Values in the Area
Average Home Value in this Area
Purchase History
| Date | Buyer | Sale Price | Title Company |
|---|---|---|---|
| Merrell Robin W | $69,900 | -- | |
| Holcombe Thomas Matthew | $11,000 | -- | |
| Foster Wanda Kay Frazier | -- | -- |
Source: Public Records
Mortgage History
| Date | Status | Borrower | Loan Amount |
|---|---|---|---|
| Open | Merrell Robin W | $68,633 |
Source: Public Records
Tax History
| Year | Tax Paid | Tax Assessment Tax Assessment Total Assessment is a certain percentage of the fair market value that is determined by local assessors to be the total taxable value of land and additions on the property. | Land | Improvement |
|---|---|---|---|---|
| 2022 | $638 | $3,197 | $413 | $2,784 |
| 2021 | $638 | $3,197 | $413 | $2,784 |
| 2020 | $625 | $3,197 | $413 | $2,784 |
| 2019 | $625 | $3,197 | $413 | $2,784 |
| 2018 | $655 | $3,197 | $413 | $2,784 |
| 2017 | $590 | $2,780 | $480 | $2,300 |
| 2016 | $590 | $2,780 | $480 | $2,300 |
| 2015 | $570 | $2,780 | $480 | $2,300 |
| 2014 | $457 | $2,184 | $480 | $1,704 |
Source: Public Records
Map
Nearby Homes
Your Personal Tour Guide
Ask me questions while you tour the home.