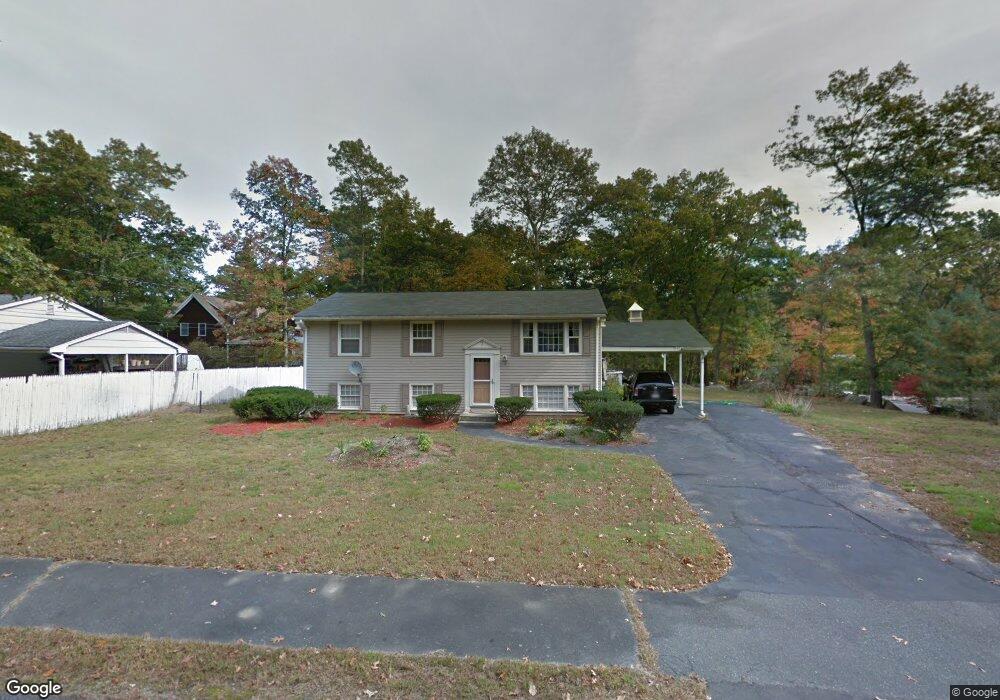
2 Gassett Rd Hopkinton, MA 01748
Estimated Value: $536,000 - $600,000
3
Beds
1
Bath
960
Sq Ft
$581/Sq Ft
Est. Value
About This Home
This home is located at 2 Gassett Rd, Hopkinton, MA 01748 and is currently estimated at $557,537, approximately $580 per square foot. 2 Gassett Rd is a home located in Middlesex County with nearby schools including Elmwood Elementary School, Hopkins Elementary School, and Hopkinton Middle School.
Ownership History
Date
Name
Owned For
Owner Type
Purchase Details
Closed on
Nov 23, 1998
Sold by
Moshier Sharon A
Bought by
Jafri Syed B
Current Estimated Value
Home Financials for this Owner
Home Financials are based on the most recent Mortgage that was taken out on this home.
Original Mortgage
$152,000
Interest Rate
6.49%
Mortgage Type
Purchase Money Mortgage
Create a Home Valuation Report for This Property
The Home Valuation Report is an in-depth analysis detailing your home's value as well as a comparison with similar homes in the area
Home Values in the Area
Average Home Value in this Area
Purchase History
| Date | Buyer | Sale Price | Title Company |
|---|---|---|---|
| Jafri Syed B | $160,000 | -- |
Source: Public Records
Mortgage History
| Date | Status | Borrower | Loan Amount |
|---|---|---|---|
| Open | Jafri Syed B | $238,705 | |
| Closed | Jafri Syed B | $175,000 | |
| Closed | Jafri Syed B | $152,000 |
Source: Public Records
Tax History Compared to Growth
Tax History
| Year | Tax Paid | Tax Assessment Tax Assessment Total Assessment is a certain percentage of the fair market value that is determined by local assessors to be the total taxable value of land and additions on the property. | Land | Improvement |
|---|---|---|---|---|
| 2025 | $6,086 | $429,200 | $226,700 | $202,500 |
| 2024 | $5,984 | $409,600 | $215,700 | $193,900 |
| 2023 | $6,133 | $387,900 | $189,100 | $198,800 |
| 2022 | $6,005 | $352,600 | $171,900 | $180,700 |
| 2021 | $5,790 | $339,000 | $166,800 | $172,200 |
| 2020 | $5,507 | $327,400 | $162,800 | $164,600 |
| 2019 | $5,256 | $306,100 | $156,600 | $149,500 |
| 2018 | $4,980 | $294,700 | $149,300 | $145,400 |
| 2017 | $4,783 | $284,700 | $144,800 | $139,900 |
| 2016 | $4,731 | $277,800 | $142,000 | $135,800 |
| 2015 | $4,732 | $263,500 | $138,000 | $125,500 |
Source: Public Records
Map
Nearby Homes