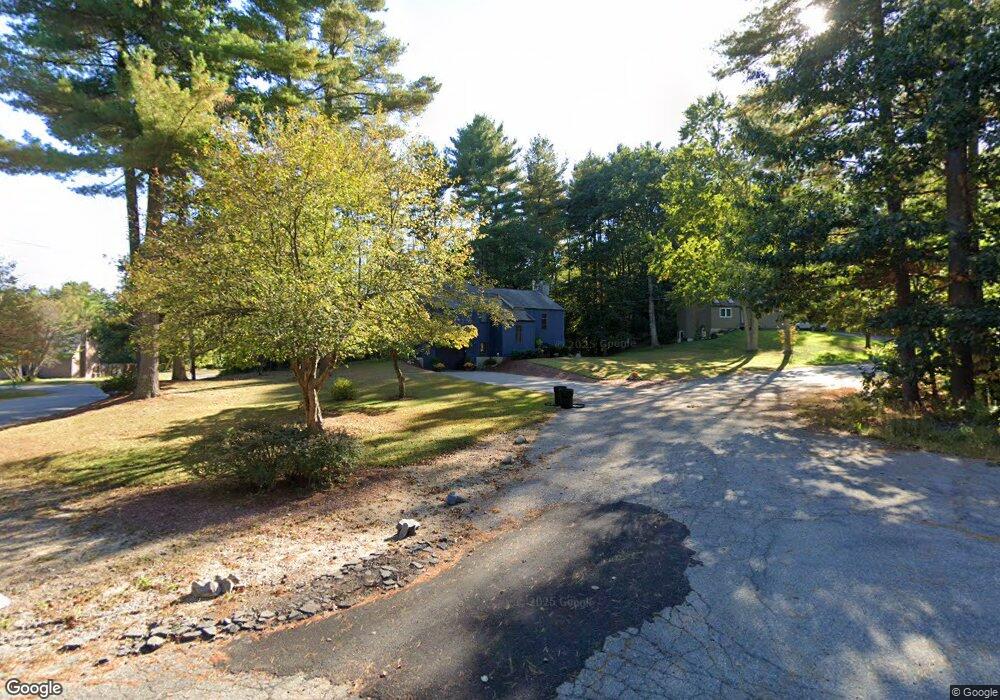
2 Gemini Ln Townsend, MA 01469
Estimated Value: $483,593 - $625,000
3
Beds
2
Baths
1,752
Sq Ft
$306/Sq Ft
Est. Value
About This Home
This home is located at 2 Gemini Ln, Townsend, MA 01469 and is currently estimated at $535,898, approximately $305 per square foot. 2 Gemini Ln is a home located in Middlesex County with nearby schools including North Middlesex Regional High School.
Ownership History
Date
Name
Owned For
Owner Type
Purchase Details
Closed on
May 9, 2006
Sold by
Ronan John J and Hough Kimberly A
Bought by
Ronan John J and Ronan Kimberly A
Current Estimated Value
Home Financials for this Owner
Home Financials are based on the most recent Mortgage that was taken out on this home.
Original Mortgage
$256,500
Outstanding Balance
$148,044
Interest Rate
6.34%
Mortgage Type
Purchase Money Mortgage
Estimated Equity
$387,854
Purchase Details
Closed on
Jan 13, 1995
Sold by
Johnson Kevin E and Johnson Kimberly A
Bought by
Hough Kimberly A and Ronan John J
Purchase Details
Closed on
May 31, 1989
Sold by
Mahoney Eirene M
Bought by
Johnson Kevin
Create a Home Valuation Report for This Property
The Home Valuation Report is an in-depth analysis detailing your home's value as well as a comparison with similar homes in the area
Home Values in the Area
Average Home Value in this Area
Purchase History
| Date | Buyer | Sale Price | Title Company |
|---|---|---|---|
| Ronan John J | -- | -- | |
| Hough Kimberly A | $128,900 | -- | |
| Johnson Kevin | $159,000 | -- |
Source: Public Records
Mortgage History
| Date | Status | Borrower | Loan Amount |
|---|---|---|---|
| Open | Ronan John J | $256,500 | |
| Previous Owner | Johnson Kevin | $45,115 | |
| Previous Owner | Johnson Kevin | $20,000 | |
| Previous Owner | Johnson Kevin | $10,000 |
Source: Public Records
Tax History
| Year | Tax Paid | Tax Assessment Tax Assessment Total Assessment is a certain percentage of the fair market value that is determined by local assessors to be the total taxable value of land and additions on the property. | Land | Improvement |
|---|---|---|---|---|
| 2025 | $5,799 | $399,400 | $91,200 | $308,200 |
| 2024 | $5,755 | $399,400 | $91,200 | $308,200 |
| 2023 | $5,498 | $360,300 | $78,700 | $281,600 |
| 2022 | $5,378 | $305,400 | $72,100 | $233,300 |
| 2021 | $5,347 | $291,700 | $71,300 | $220,400 |
| 2020 | $5,222 | $267,500 | $64,600 | $202,900 |
| 2019 | $4,883 | $252,600 | $64,600 | $188,000 |
| 2018 | $4,684 | $231,200 | $58,000 | $173,200 |
| 2017 | $4,499 | $228,700 | $60,900 | $167,800 |
| 2016 | $4,010 | $202,500 | $60,900 | $141,600 |
| 2015 | $3,996 | $209,100 | $67,500 | $141,600 |
| 2014 | $3,984 | $203,600 | $63,400 | $140,200 |
Source: Public Records
Map
Nearby Homes
- 18 Beech St
- Lot 10 Christian Cir
- 167 S Row Rd
- 00 Tyler Rd
- 367 Mulpus Rd
- 91 Valley Rd
- 21 Magnolia Ln
- 0 Tyler Rd Unit 72560808
- 1 Depot Street Extension Unit 5
- 1 Depot Street Extension Unit 2
- 1 Depot Street Extension Unit 4
- 36 Gilchrest St
- 92 Squannacook Rd
- 16 Worcester Rd
- 146 Elmwood Rd
- 43 Shattuck St
- 5 Turnpike Rd Unit 213 TWO
- 12 Cortland Cir Unit 12
- 44 Squannacook Rd
- 26 Bradley Dr Unit D
Your Personal Tour Guide
Ask me questions while you tour the home.