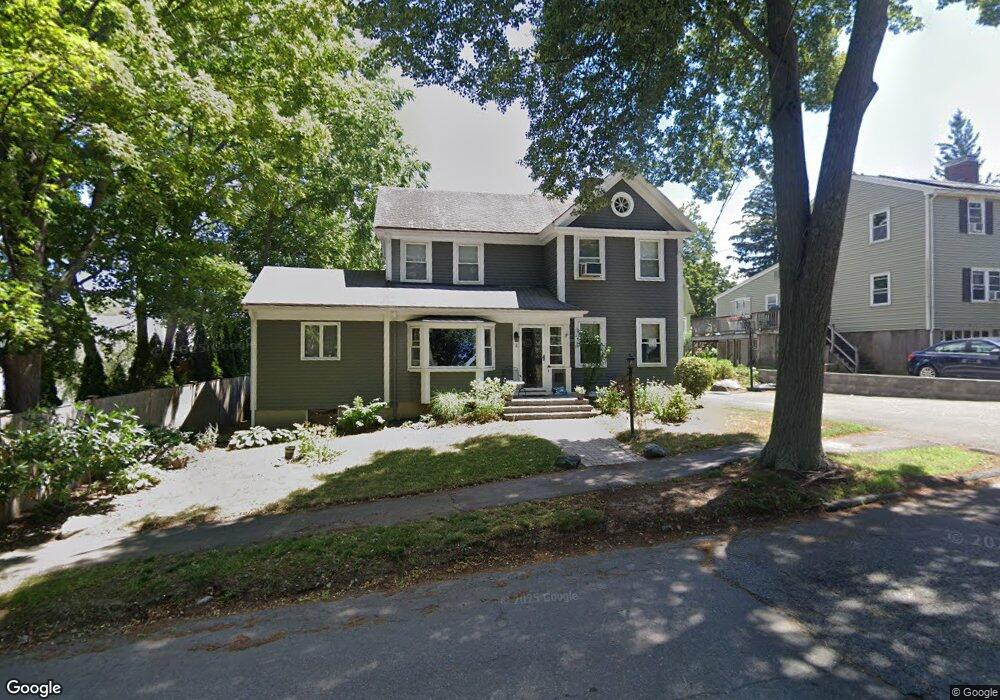
2 Goodyear St Beverly, MA 01915
North Beverly NeighborhoodEstimated Value: $806,841 - $953,000
4
Beds
3
Baths
2,054
Sq Ft
$421/Sq Ft
Est. Value
About This Home
This home is located at 2 Goodyear St, Beverly, MA 01915 and is currently estimated at $864,710, approximately $420 per square foot. 2 Goodyear St is a home located in Essex County with nearby schools including Beverly High School, The Saints Academy, and Shore Country Day School.
Ownership History
Date
Name
Owned For
Owner Type
Purchase Details
Closed on
Aug 15, 2003
Sold by
Kossover Patficia A
Bought by
Keve Lance A
Current Estimated Value
Home Financials for this Owner
Home Financials are based on the most recent Mortgage that was taken out on this home.
Original Mortgage
$300,000
Outstanding Balance
$126,130
Interest Rate
5.46%
Mortgage Type
Purchase Money Mortgage
Estimated Equity
$738,580
Create a Home Valuation Report for This Property
The Home Valuation Report is an in-depth analysis detailing your home's value as well as a comparison with similar homes in the area
Home Values in the Area
Average Home Value in this Area
Purchase History
| Date | Buyer | Sale Price | Title Company |
|---|---|---|---|
| Keve Lance A | $425,000 | -- |
Source: Public Records
Mortgage History
| Date | Status | Borrower | Loan Amount |
|---|---|---|---|
| Open | Keve Lance A | $300,000 | |
| Previous Owner | Keve Lance A | $188,500 | |
| Previous Owner | Keve Lance A | $190,000 |
Source: Public Records
Tax History
| Year | Tax Paid | Tax Assessment Tax Assessment Total Assessment is a certain percentage of the fair market value that is determined by local assessors to be the total taxable value of land and additions on the property. | Land | Improvement |
|---|---|---|---|---|
| 2025 | $7,603 | $691,800 | $365,100 | $326,700 |
| 2024 | $7,351 | $654,600 | $327,900 | $326,700 |
| 2023 | $7,119 | $632,200 | $305,500 | $326,700 |
| 2022 | $7,037 | $578,200 | $251,500 | $326,700 |
| 2021 | $6,590 | $518,900 | $221,700 | $297,200 |
| 2020 | $6,442 | $502,100 | $204,900 | $297,200 |
| 2019 | $6,317 | $475,800 | $190,000 | $285,800 |
| 2018 | $6,124 | $450,300 | $186,300 | $264,000 |
| 2017 | $5,845 | $409,300 | $145,300 | $264,000 |
| 2016 | $5,729 | $398,100 | $134,100 | $264,000 |
| 2015 | $5,617 | $398,100 | $134,100 | $264,000 |
Source: Public Records
Map
Nearby Homes
- 50 Balch St Unit 205
- 412 Cabot St
- 9 Swan St Unit 3
- 9 Swan St Unit 2
- 6 Charles St
- 13 Giles Ave Unit 2
- 2 Duck Pond Rd Unit 108
- 40 Heather St Unit 204
- 508 Elliott St
- 348 Rantoul St Unit 202
- 34 Chase St
- 315 Rantoul St Unit 406
- 14 Harrison Ave
- 261 Rantoul St
- 27 Folger Ave
- 28 Columbus Ave Unit 3
- 123 Livingstone Ave
- 98 Northridge Rd Unit 98
- The Cabot Collection
- 17 Pond St
Your Personal Tour Guide
Ask me questions while you tour the home.